





XAG/USD is attempting to regain momentum after a volatile decline from its early-May highs.
Price has recently stabilized in the high-50s, where buyers have repeatedly stepped in and prevented a deeper breakdown.
The latest advance has brought silver back toward the important 60.00 area, putting nearby resistance and the strength of the recovery in focus.
Can buyers turn this rebound into a sustained move higher, or will overhead selling pressure send price back into its recent range?
Welcome to “TA Alert of the Day.” Each day after the market close, MarketMilk scans for popular technical indicator alerts. We use these alerts as the basis for a mini-lesson, breaking down what each alert means, why it matters, and how traders might interpret it. The goal is to help beginner traders not only spot these alerts but also understand the logic behind them and how they can inform trading decisions.
What MarketMilk Has Detected
MarketMilk detected a bullish 5-day SMA crossover above the 20-day SMA.
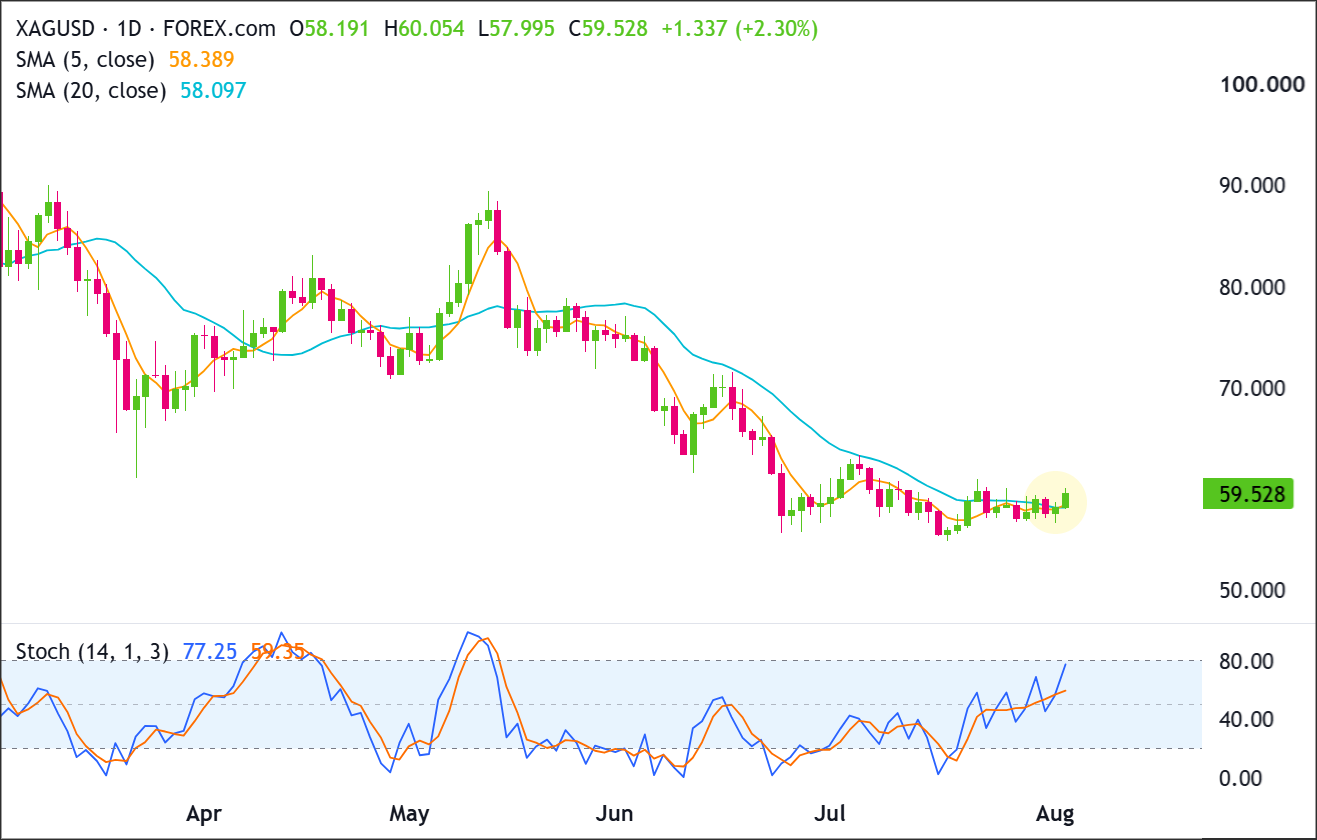
This crossover arrives after a broader decline from the early-May highs (with price reaching into the 86–89 area) down into late-June weakness near the 57–58 zone.
Since that drop, XAG/USD has been attempting to stabilize and rebase, with repeated activity around the high-50s.
What This Signals
Traditionally, a 5 SMA crossing above the 20 SMA suggests that short-term price action is improving faster than the intermediate trend.
If the move is sustained, it can attract trend-following traders and often marks a transition from consolidation to a more constructive upswing, particularly when price continues to hold above the moving averages.
Alternatively, the crossover can be more of a mean reversion signal than a trend signal: after prolonged weakness, a rebound lifts the short average, but the market may still be capped by prior breakdown levels.In XAG/USD, the mid/upper-60s zone has previously acted as a pivot area, and earlier support failures there have historically coincided with renewed selling pressure.
The outcome depends heavily on follow-through price action, proximity to overhead resistance, and whether volatility expands in the direction of the break.
How It Works
A simple moving average (SMA) crossover compares two averages of closing prices over different lookback windows.
The 5-day SMA reacts quickly to recent price changes, while the 20-day SMA smooths price action over roughly a trading month.
When the shorter SMA rises above the longer SMA, it indicates that recent closes are, on average, strengthening relative to the intermediate baseline.Because SMAs are calculated from past prices, crossovers often confirm a shift that has already started rather than predict it.
They tend to be most useful when aligned with a clear trend and less reliable when price is ranging and repeatedly crossing back and forth around the averages.
Important: SMA crossovers can “work” for very different reasons (trend continuation, rebound after a selloff, or short squeeze dynamics). Their reliability often improves when the crossover occurs alongside a break of a well-defined resistance level and when pullbacks hold above the moving averages instead of immediately failing back into the prior range.
What to Look For Before Acting
Don’t assume the crossover guarantees a sustained uptrend. Consider these factors:
✅ Whether XAG/USD can hold above the 20 SMA on daily closes over the next several sessions
✅ A clean push through nearby resistance around 60.0–60.9 (recent swing highs) rather than immediate rejection
✅ Evidence that prior “base” support near 57.6–58.3 continues to attract buyers on pullbacks
✅ Whether the next pullback forms a higher low relative to the late-July/early-August dips
✅ The slope of the 20 SMA turning upward (crossovers can be less durable when the 20 SMA is still flat/down)
✅ Signs of reduced whipsaw: fewer large intraday reversals like the recent wide daily ranges
✅ Alignment check on a Weekly chart: is price still below key weekly pivots from the prior downtrend?
✅ Any notable macro catalysts that can move precious metals pricing (e.g., USD moves, interest rate expectations, central bank messaging)
Risk Considerations
⚠️ Whipsaw risk: the 5/20 crossover can quickly reverse if XAG/USD remains range-bound
⚠️ Overhead supply: prior breakdown areas (e.g., low-60s and mid-60s pivots) can trigger selling into rallies
⚠️ Lagging nature: the crossover may occur after much of the initial rebound has already happened
⚠️ Volatility spikes: large daily ranges can widen stops and increase the chance of stop-outs even if the bias is correct
Potential Next Steps
Add XAG/USD to a watchlist and monitor whether price can remain above the 20 SMA while challenging resistance near 60.
XAG/USD remains in a broader downtrend, but the recent base around 55.50–57.00 is beginning to produce a recovery.
Price has closed above the 5-day SMA at 58.389 and the 20-day SMA at 58.097, shifting near-term momentum in favor of buyers.
Immediate resistance sits at 60.00–61.00, while the more important upside objective is the mid-June swing high near 70.00.
Stochastic has advanced to 77.25, showing strong momentum but also approaching overbought territory.
Price spent several sessions consolidating between approximately 56.00 and 60.00 before printing a strong bullish daily candle near the top of that range.
Buyers now need a decisive close above 60.00–61.00 to confirm a breakout and establish a higher high.
A rejection from that ceiling followed by a loss of 58.00–58.40 would suggest the latest advance was another failed recovery within the broader bearish structure.
Trade Idea: Bullish Continuation Scenario
Setup
The bullish setup depends on XAG/USD holding above the recently reclaimed 58.00–58.40 area and converting 60.00–61.00 from resistance into support.
A confirmed breakout would strengthen the developing sequence of higher lows and create room for a larger recovery toward the mid-June swing high near 70.00.
Entry
Consider entering long on a daily close above 61.00, confirming that buyers are breaking out of the recent structure.
Alternatively, enter on a controlled pullback into 58.00–58.40 if price stabilizes there and turns back higher.
If price loses that support zone and closes decisively below 57.80, stand aside and wait for either deeper support to form or a cleaner breakout later.
Stop Loss
For breakout entries: stop on a daily close back below 60.00. That would invalidate the breakout by showing price could not stay above the former ceiling.
For pullback entries: stop on a daily close below 57.80. That would invalidate the support-hold idea and show buyers are no longer defending the zone.
Take Profit
Target 70.00, because that is the prominent mid-June swing high and the next major upside area price could revisit if the recovery develops into a broader trend reversal.
Bottom Line
The bullish case strengthens on a daily close above 61.00, which would confirm that XAG/USD has escaped its recent consolidation and could begin extending toward the mid-June swing high at 70.00.
The setup remains constructive while price holds 58.00–58.40. A decisive close below 57.80 would invalidate the immediate continuation scenario.
This trade idea hinges on the 58.00-58.40 zone holding as support and 60.00-61.00 flipping from resistance to support on a breakout, concepts that go deeper than basic support and resistance. Premium members can read our lesson:
📖 Beyond Support and Resistance: Supply and Demand Zones
Reading this helps you understand how to identify true supply and demand zones, why a former resistance zone can become reliable support once reclaimed, and how to grade the quality of a zone before you trust it in a setup like this one.
And if you’re not a Premium subscriber yet, now’s a good time to sign up.
With Babypips Premium, you get full access to School of Pipsology lessons that help you understand not just where a level sits on the chart, but how to grade the zone behind it before you put a trade on.
Trade Idea: Bearish Pullback Scenario
Setup
The bearish setup would develop if price fails inside 60.00–61.00 and falls back through the reclaimed support around 58.00–58.40.
Such a move would signal that buyers could not sustain the breakout attempt and would expose the recent base around 55.50–56.00.
Entry
Consider entering short on a daily close below 57.80, confirming that the support zone has failed.
Alternatively, if price pushes into 60.00–61.00 and prints a clear bearish rejection candle, enter short on the next daily close back below 59.00.
If price instead breaks and closes decisively above 61.00, stand aside, as that would invalidate the bearish pullback idea.
Stop Loss
For breakdown entries: stop on a daily close back above 58.40. That would invalidate the breakdown by showing price has reclaimed the support zone.
For rejection entries near resistance: stop on a daily close above 61.00. That would invalidate the bearish idea by confirming buyers have pushed through resistance.
Take Profit
Target 55.50–56.00, because that is the next major support area below the current structure and the most likely place where buyers would try to step back in.
Bottom Line
The bearish case depends on XAG/USD failing at 60.00–61.00 and then closing below 57.80, confirming that the latest recovery has lost momentum.
A successful breakdown would bring 55.50–56.00 back into focus. A decisive close above 61.00 would invalidate the bearish pullback scenario.
This content is strictly for informational purposes only and does not constitute as investment advice. Trading any financial market involves risk. Please read our Risk Disclosure to make sure you understand the risks involved.



