


XAG/USD is back on traders’ radar after flashing a fresh technical signal that hints at a possible shift in momentum.
After a choppy recovery from recent lows, price action is now testing whether buyers have enough conviction to push through nearby resistance.
The setup looks constructive, but confirmation still matters, especially with volatility elevated and the market approaching a zone where previous rallies have struggled.
Welcome to “TA Alert of the Day.” Each day after the market close, MarketMilk scans for popular technical indicator alerts. We use these alerts as the basis for a mini-lesson, breaking down what each alert means, why it matters, and how traders might interpret it. The goal is to help beginner traders not only spot these alerts but also understand the logic behind them and how they can inform trading decisions.
What MarketMilk Has Detected
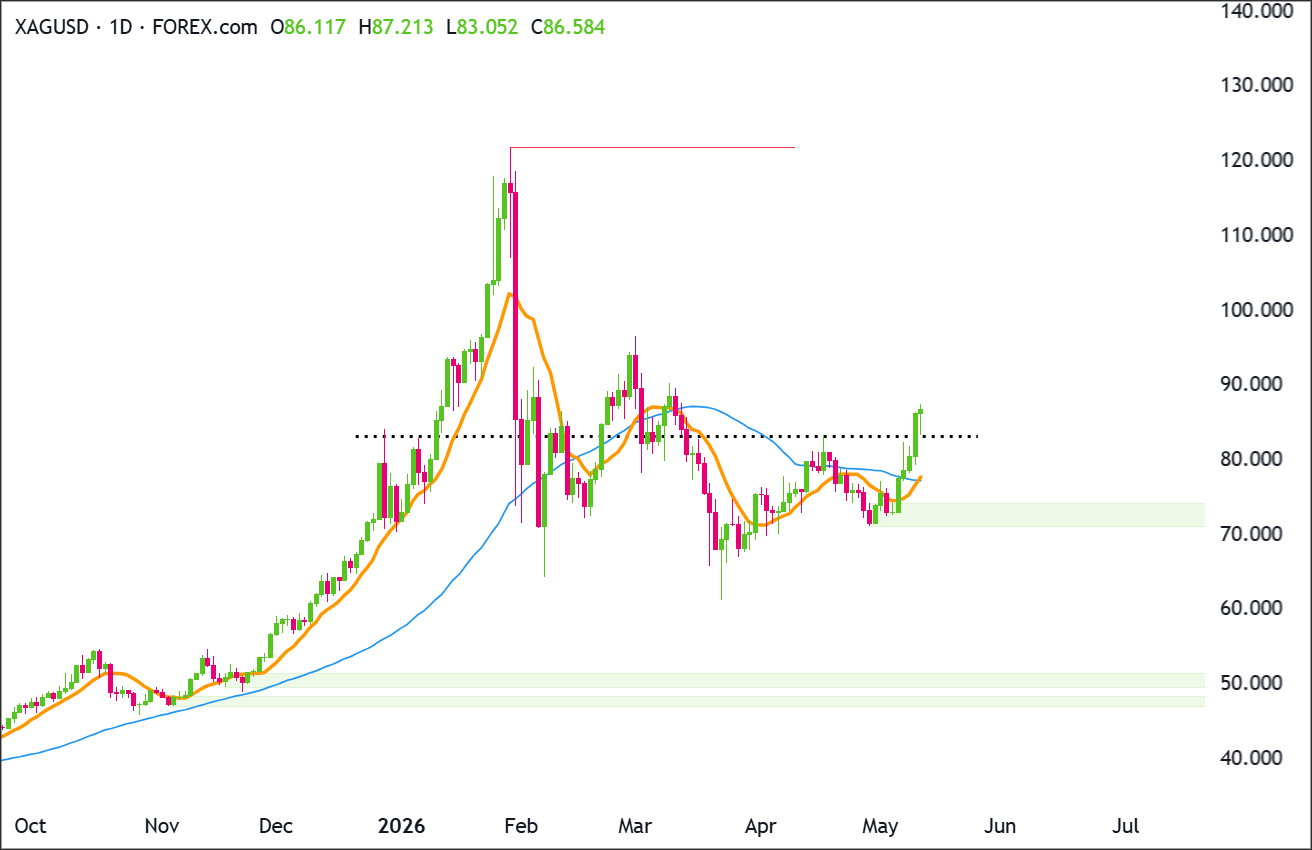
MarketMilk detected a 10-day SMA crossover above the 50-day SMA, a classic “faster over slower” trend signal on the 1D timeframe.
The crossover formed as the 10 SMA (orange) climbed above the 50 SMA (blue).
XAGUSD is trying to shift back into a bullish structure after reclaiming the former resistance area around 83.00-84.00.
The recent advance has pushed price above the April consolidation ceiling, with current price near 86.00 and the next visible upside resistance sitting around the March swing area near 94.00-96.00.
Key support now sits at 83.00-84.00, with deeper demand around 72.00-74.00 and major lower support around 48.00-51.00.
What This Signals
Traditionally, a 10/50 SMA bullish crossover suggests that upside momentum over the last two weeks is beginning to dominate the broader 10-week trend.
If the move holds, it may draw in systematic and trend-following traders, potentially shifting the market from a short-term rebound into a more durable uptrend.However, this same pattern can also represent a late confirmation after price has already moved significantly.
Crossovers sometimes occur near inflection points where prices briefly surge, trigger trend signals, and then mean-revert, especially if the market is still rotating inside a wider range or running into overhead supply (such as the 88–91 area).
Alternatively, the signal may be less about a fresh trend and more about recovery from a prior drawdown.
After the March slide from the mid-80s toward the low-60s, even a moderate rebound can lift the 10 SMA above the 50 SMA without guaranteeing smooth continuation.
Pullbacks toward former resistance-turned-support can still occur.
The outcome depends heavily on trend structure, nearby resistance levels, and whether price can hold above the moving averages during the next pullback.
How It Works
The Simple Moving Average (SMA) is the average closing price over a fixed lookback period.
A 10-day SMA reacts relatively quickly to recent price changes, while a 50-day SMA moves more slowly and is often used as a medium-term trend filter.
A bullish crossover happens when the faster SMA rises above the slower SMA, indicating that recent prices are, on average, stronger than the medium-term baseline.
Because moving averages are derived from past data, crossovers are lagging signals.
They tend to confirm a move that has already started rather than predict a turn in advance.
Important: SMA crossovers can be prone to whipsaws in sideways markets. Their usefulness often improves when the crossover occurs alongside a clear break of resistance (or after multiple successful tests of support) and when the slope of the 50 SMA begins to flatten and turn upward.
What to Look For Before Acting
Do not assume an uptrend will continue. Consider these factors:
✅ Whether XAG/USD can hold above the 10 SMA and 50 SMA on a pullback (support behavior matters more than the crossover itself)
✅ A daily close that remains firm above the prior congestion band near 73.00–76.00, reinforcing the breakout/reclaim
✅ How price behaves into the next overhead resistance zone around 88.20–91.30 (late-February highs)
✅ The slope of the 50 SMA: continued flattening/turning up tends to support trend interpretation
✅ Evidence of higher highs and higher lows on the daily structure rather than single-candle spikes
✅ Confirmation from the 4-Hour or Weekly chart (alignment across timeframes, not just the daily signal)
✅ Whether recent wide ranges compress or expand further (volatility regime can impact stop placement and signal quality)
✅ Cross-asset context (e.g., broad USD strength/weakness and rates sensitivity), since XAG/USD often responds to macro shifts
Risk Considerations
⚠️ Lag risk: the crossover may occur after a large portion of the move, increasing pullback risk
⚠️ Whipsaw risk: if XAG/USD is still range-bound, price can chop around the averages and invalidate the signal
⚠️ Overhead supply: prior highs near 88–91 may cap price and trigger reversals or failed breakouts
⚠️ Volatility risk: wide daily ranges can create stop-outs even when the broader direction remains intact
⚠️ Event risk: macro surprises (rates, USD drivers) can override technically derived signals
Potential Next Steps
Add XAG/USD to a watchlist for post-crossover follow-through, focusing on whether price respects the 10 SMA/50 SMA area on any retest.
If price approaches 88–91, consider waiting for either a clean break and hold above that zone or a controlled pullback that forms a higher low.
For risk management, plan around invalidation (e.g., sustained closes back below the key reclaimed band near 73–76 or repeated failure to hold above the moving averages), and size positions to account for the current daily volatility.
Trade Idea: Bullish Continuation Scenario
Setup
The bullish setup is a continuation attempt after XAGUSD reclaimed the prior range ceiling around 83.00-84.00.
As long as price holds above that reclaimed zone, the breakout structure remains constructive.
A daily close above 87.25-88.00 would confirm that buyers are extending beyond the current breakout candle and opening the door toward the next resistance zone around 94.00-96.00.
Entry
Consider entering long on a daily close above 87.25-88.00, confirming that buyers are breaking out of the recent structure.
Alternatively, enter on a controlled pullback into 83.00-84.00 if price stabilizes there and turns back higher.
If price loses that support zone and closes decisively below 83.00, stand aside and wait for either deeper support to form or a cleaner breakout later.
Stop Loss
For breakout entries: stop on a daily close back below 84.00. That would invalidate the breakout by showing price could not stay above the former ceiling.
For pullback entries: stop on a daily close below 83.00. That would invalidate the support-hold idea and show buyers are no longer defending the zone.
Take Profit
Target 94.00-96.00, because that is the next clear upside area on the chart and the most natural place for price to retest if the current recovery continues.
Bottom Line
The bullish case depends on XAGUSD holding the reclaimed 83.00-84.00 zone and following through above 87.25-88.00.
If that happens, momentum can continue toward the next visible resistance at 94.00-96.00.
The key invalidation level is a daily close below 83.00. Losing that level would suggest the breakout failed and would reduce the quality of the bullish continuation setup.
Trade Idea: Bearish Pullback Scenario
Setup
The bearish setup is a failed-breakout scenario.
XAGUSD has pushed above 83.00-84.00, but the move is extended in the short term and could reject near 87.25-88.00 if buyers cannot hold the breakout.
Sellers gain control if price closes back below 83.00, which would place the market back inside the prior range and expose the deeper support zone near 72.00-74.00.
Entry
Consider entering short on a daily close below 83.00, confirming that the support zone has failed.
Alternatively, if price pushes into 87.25-88.00 and prints a clear bearish rejection candle, enter short on the next daily close back below 84.00.
If price instead breaks and closes decisively above 88.00, stand aside, as that would invalidate the bearish pullback idea.
Stop Loss
For breakdown entries: stop on a daily close back above 84.00. That would invalidate the breakdown by showing price has reclaimed the support zone.
For rejection entries near resistance: stop on a daily close above 88.00. That would invalidate the bearish idea by confirming buyers have pushed through resistance.
Take Profit
Target 72.00-74.00, because that is the next major support area below the current structure and the most likely place where buyers would try to step back in.
Bottom Line
The bearish case depends on XAGUSD failing near 87.25-88.00 and losing the reclaimed support area with a daily close below 83.00.
That would turn the current breakout into a failed move and shift focus back toward 72.00-74.00.
The bearish setup is invalidated if price closes decisively above 88.00. In that case, sellers would be losing control and the path toward 94.00-96.00 would remain open.
This content is strictly for informational purposes only and does not constitute as investment advice. Trading any financial market involves risk. Please read our Risk Disclosure to make sure you understand the risks involved.


