


USD/JPY is flashing a momentum warning just as price remains pinned near recent highs.
The pair has been grinding higher over the past several weeks, but the latest session showed a small dip and a shift in oscillator behavior.
When momentum turns while price is elevated, traders often pay closer attention to whether follow-through appears.
This is a “watch closely” moment rather than a “trade blindly” moment.
Welcome to “TA Alert of the Day.” Each day after the market close, MarketMilk scans for popular technical indicator alerts. We use these alerts as the basis for a mini-lesson, breaking down what each alert means, why it matters, and how traders might interpret it. The goal is to help beginner traders not only spot these alerts but also understand the logic behind them and how they can inform trading decisions.
What MarketMilk Has Detected
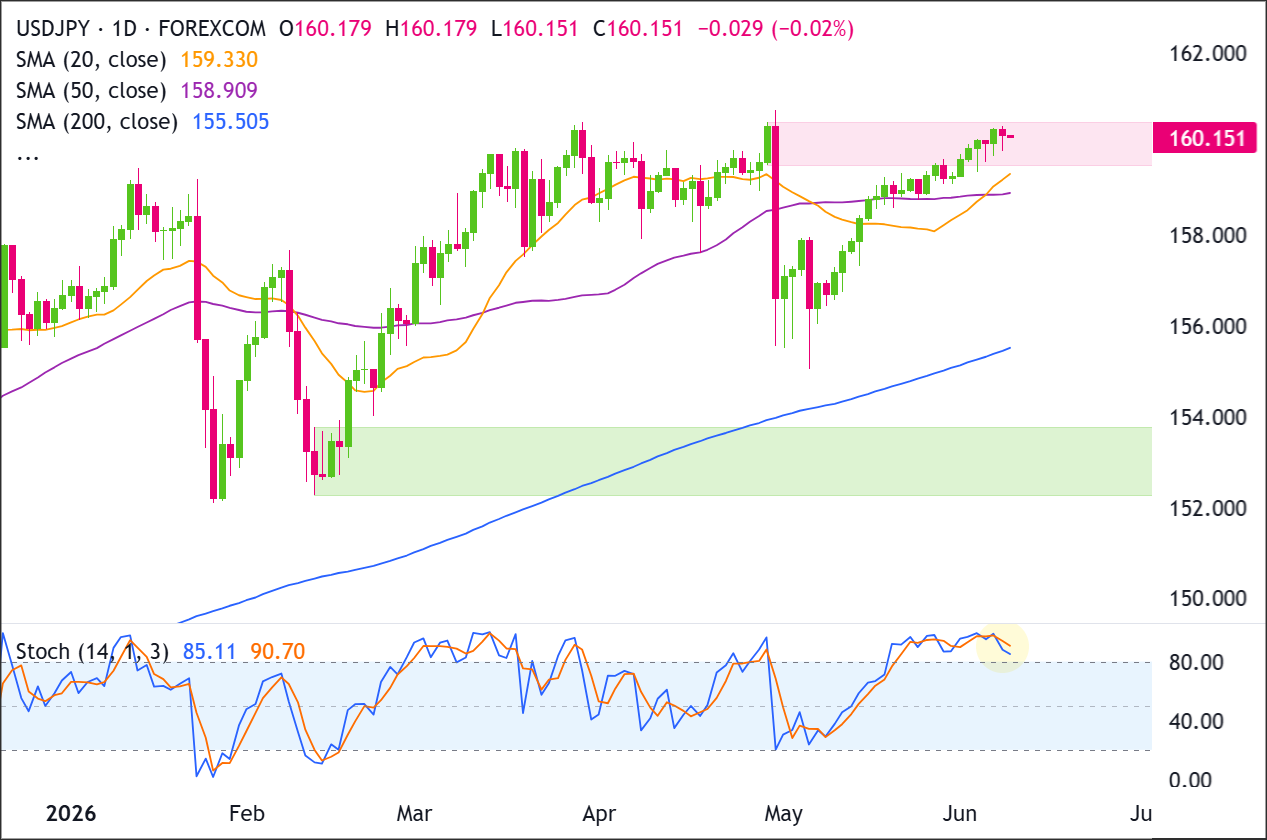
MarketMilk detected a bearish Stochastic (14,3,3) crossover on the daily chart
Notably, both lines remain above 80, meaning the signal is occurring in overbought momentum territory/
USD/JPY rebounded strongly from the late-April selloff low near 155.55 and has since pushed back to the 160.0–160.7 zone, which has acted as an upside area of interest (highs seen around 160.72 and 160.46).
The current bar’s pullback (low near 159.84) keeps price close to the psychological 160.00 handle.
What This Signals
Traditionally, a %K below %D crossover above 80 can attract attention as a sign that upside momentum is cooling.
In many markets, this type of rollover often marks the start of a consolidation phase or a pullback attempt, especially if price is pressing into a known resistance zone like 160.4–160.7.
If the move is sustained, traders sometimes interpret it as early evidence that buyers are becoming less aggressive at the highs.
However, this same pattern can also represent a brief momentum reset within an ongoing uptrend.
In strong trends, Stochastic can remain elevated for extended periods, and crossovers can occur multiple times without producing meaningful downside, sometimes coinciding with shallow dips that quickly get bought.In that scenario, the crossover becomes more of a “noise signal” unless price starts breaking nearby support levels.
Alternatively, the crossover may precede a bull-trap style pullback if the market had been relying on momentum to push through the 160.4–160.7 area and then fails to hold above 160.0.
That combination, momentum rolling over while price stalls near prior highs, sometimes coincides with a sharper mean-reversion move back toward the mid-range of the prior advance.
The outcome depends heavily on follow-through price action, the broader trend structure since the late-April low, and how USD/JPY behaves around nearby pivot levels (160.0 first, then the upper-159s).
Context and confirmation are essential, particularly because this is a momentum signal rather than a direct support/resistance break.
How It Works
The Stochastic Oscillator measures where the close sits relative to the recent 14-period high–low range.
The %K line is the faster momentum component, while %D is a smoothed signal line.
A bearish crossover happens when %K drops below %D, indicating that short-term momentum is weakening compared with its recent average.Readings above 80 reflect overbought momentum (strong upside positioning), while readings below 20 reflect oversold momentum.
Because Stochastic is sensitive, it can produce multiple crossovers during trending phases, so traders commonly look for confirmation from price structure (breaks of short-term supports) rather than treating the crossover alone as decisive.
Important: Overbought momentum is not the same as being “overvalued.” In persistent uptrends, Stochastic can stay above 80 and still see price continue higher, which is why confirmation and nearby level-awareness matter more than the crossover by itself.
What to Look For Before Acting
Do not assume USD/JPY is about to reverse lower. Consider these factors:
✅ Whether price holds below 160.0 on a daily closing basis (a common near-term pivot level)
✅ A follow-through downside day that starts to build lower highs / lower lows from the 160.4–160.7 area
✅ Stochastic follow-through: %K continuing to fall and ideally moving down through 80 (often read as momentum rotating out of overbought)
✅ Evidence of supply near the highs (e.g., repeated failures to reclaim 160.32–160.39 from the current bar’s range)
✅ How price reacts at the upper-159s (a potential near-term support band given recent clustering around 159.2–159.9)
✅ Alignment check on a higher timeframe: review the Weekly chart to see whether this is occurring into major resistance or within a broader uptrend leg
✅ Volatility expansion: a larger-than-recent daily range can confirm that momentum is translating into actual price movement
✅ Macro catalysts relevant to USD/JPY (e.g., rate expectations, central bank communication, intervention action, and risk sentiment) that could amplify or negate oscillator signals
Risk Considerations
⚠️ Trend persistence risk: in strong uptrends, bearish Stochastic crossovers above 80 can whipsaw and fail quickly
⚠️ False-signal risk near highs: price can briefly dip, reset momentum, and then resume higher without breaking structure
⚠️ Level proximity risk: with price still near 160.0, small moves can flip the narrative without providing clear confirmation
⚠️ Event-driven gaps: USD/JPY can react sharply to policy or data surprises, overriding oscillator-based setups
Potential Next Steps
Consider placing USD/JPY on a watchlist and monitoring whether price can stay capped below the 160.4–160.7 resistance zone.
Recent candles show buyers pressing into the prior ceiling around 160.00-160.70, but momentum is starting to cool near the highs.
A daily close above 160.70 would confirm continuation, while failure to hold 158.90-159.30 would suggest the breakout attempt is weakening and open the door for a pullback toward 155.50-156.00.
Because this is USD/JPY and price is trading near the psychologically important 160.00 area, currency intervention risk should be kept in mind, as sharp yen-driven reversals can occur without much technical warning.
Trade Idea: Bullish Continuation Scenario
Setup
The bullish setup depends on USD/JPY holding above the moving-average support zone at 158.90-159.30 and then breaking through the current resistance zone at 160.50-160.70.
If buyers can force a daily close above 160.70, the recent recovery would confirm a continuation move and put 162.00 back in play.
Entry
Consider entering long on a daily close above 160.70, confirming that buyers are breaking out of the recent structure.
Alternatively, enter on a controlled pullback into 158.90-159.30 if price stabilizes there and turns back higher.
If price loses that support zone and closes decisively below 158.90, stand aside and wait for either deeper support to form or a cleaner breakout later.
Stop Loss
For breakout entries: stop on a daily close back below 160.00. That would invalidate the breakout by showing price could not stay above the former ceiling.
For pullback entries: stop on a daily close below 158.90. That would invalidate the support-hold idea and show buyers are no longer defending the zone.
Take Profit
Target 162.00, because that is the next clear upside area on the chart and the most natural place for price to retest if the current recovery continues.
Bottom Line
The bullish case is strongest if USD/JPY closes above 160.70 and holds the breakout. That would confirm buyers have absorbed the resistance zone and could support continuation toward 162.00.
The key invalidation level is 158.90. A daily close below 158.90 would weaken the bullish setup and suggest price may need a deeper reset before another continuation attempt.
Trade Idea: Bearish Pullback Scenario
Setup
The bearish setup is based on USD/JPY failing inside the resistance zone at 160.50-160.70 while momentum is stretched.
Sellers would need price to lose the support cluster around 158.90-159.30 to confirm that the recent push into resistance has failed.
Entry
Consider entering short on a daily close below 158.90, confirming that the support zone has failed.
Alternatively, if price pushes into 160.50-160.70 and prints a clear bearish rejection candle, enter short on the next daily close back below 160.00.
If price instead breaks and closes decisively above 160.70, stand aside, as that would invalidate the bearish pullback idea.
Stop Loss
For breakdown entries: stop on a daily close back above 159.30. That would invalidate the breakdown by showing price has reclaimed the support zone.
For rejection entries near resistance: stop on a daily close above 160.70. That would invalidate the bearish idea by confirming buyers have pushed through resistance.
Take Profit
Target 155.50-156.00, because that is the next major support area below the current structure and the most likely place where buyers would try to step back in.
Bottom Line
The bearish case depends on USD/JPY failing at 160.50-160.70 and then closing below 158.90. That would show the current resistance test has failed and could trigger a pullback toward 155.50-156.00.
The bearish idea is invalidated on a decisive daily close above 160.70. A breakout above 160.70 would shift control back to buyers and keep 162.00 as the next upside target.
This content is strictly for informational purposes only and does not constitute as investment advice. Trading any financial market involves risk. Please read our Risk Disclosure to make sure you understand the risks involved.


