





USD/CHF has pushed sharply higher and is now testing an area where the rally could either extend or start to lose steam.
The focus is on whether buyers can keep control and drive the pair higher, or whether sellers step in and trigger a pullback.
Welcome to “TA Alert of the Day.” Each day after the market close, MarketMilk scans for popular technical indicator alerts. We use these alerts as the basis for a mini-lesson, breaking down what each alert means, why it matters, and how traders might interpret it. The goal is to help beginner traders not only spot these alerts but also understand the logic behind them and how they can inform trading decisions.
What MarketMilk Has Detected
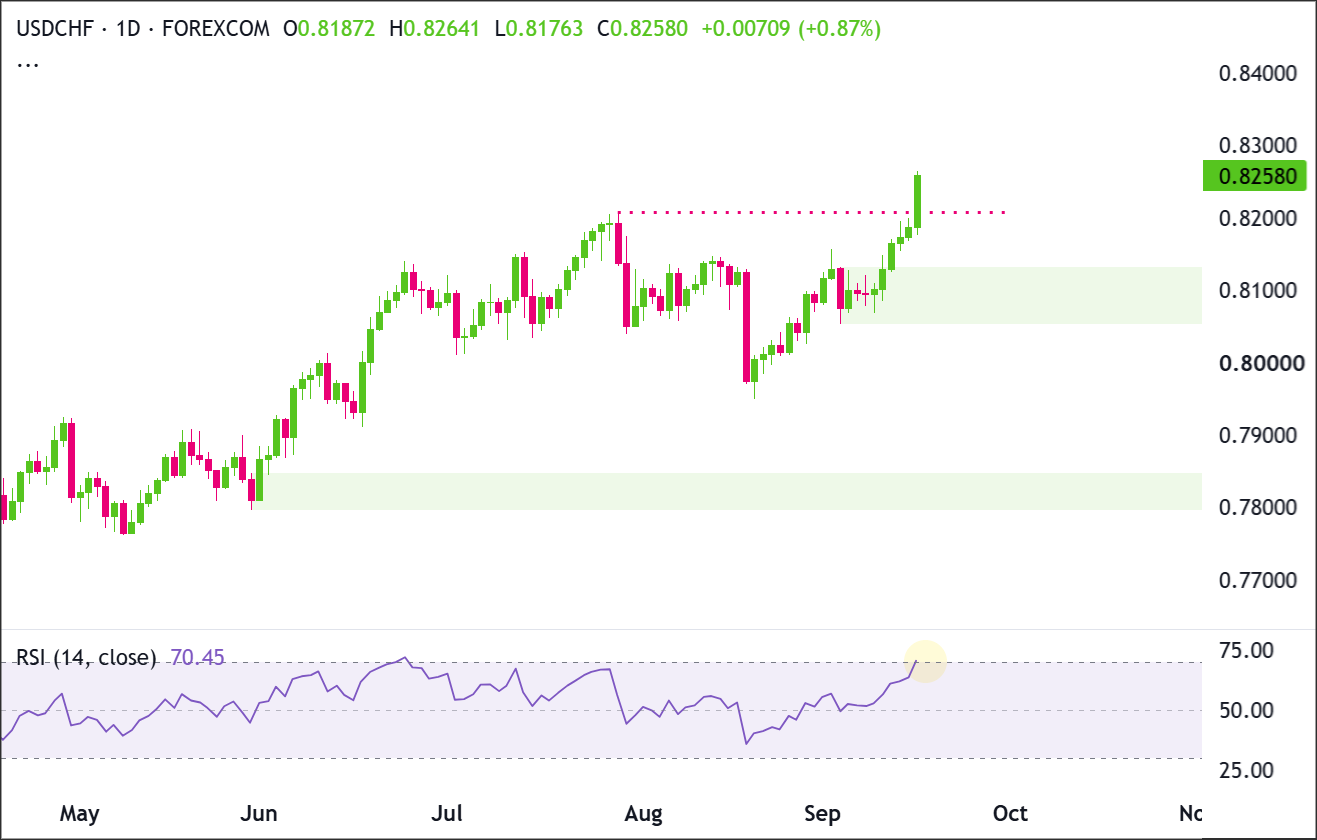
MarketMilk detected that RSI crossed above 70, reaching 70 on the Daily timeframe as USD/CHF continued its recent climb.
What This Signals
An RSI move above 70 is considered an overbought reading, meaning recent price gains have been strong and buying momentum has been dominant.
Some traders watch this condition for signs that the move may begin to slow, consolidate, or pull back.
However, an overbought reading does not automatically mean price is about to fall. In a strong uptrend, RSI can remain above 70 for an extended period while buyers continue pushing price higher.If USD/CHF keeps making higher highs and higher lows, the reading may reflect continued trend strength rather than an imminent reversal.
On the other hand, if buyers struggle to push price higher and price begins showing signs of rejection, sellers may start gaining control.
A lower high, a break of nearby support, or weaker follow-through to the upside would provide stronger evidence that momentum is fading. RSI turning lower can support that view, but should not be used as confirmation by itself.
The key is to watch what price does next.
Continued higher highs and higher lows would support further upside, while rejection and a break in the recent bullish structure could point to a pullback.
How It Works
RSI (Relative Strength Index) is a momentum indicator that measures the strength of recent price moves, typically over 14 periods.
It compares the size of recent gains with the size of recent losses and gives a reading from 0 to 100.
Readings above 70 are commonly considered overbought, while readings below 30 are commonly considered oversold.
In practice, RSI helps traders see when price has been moving strongly in one direction.
An “overbought” reading does NOT mean that price must fall. It simply means recent gains have been much stronger than recent losses.
Important: RSI signals are more reliable when paired with structure (support/resistance), clear trend context, and subsequent price confirmation. Overbought readings can persist in strong trends, and the first cross above 70 can sometimes occur early in a larger impulse move.
What to Look For Before Acting
Don’t assume a bearish reversal is imminent. Instead, watch for signs that either buyers remain in control or sellers are starting to take over:
✅ Whether pullbacks stay shallow and buyers continue stepping in.
✅ Whether price keeps making higher highs and higher lows.
✅ Signs of continued strength, such as strong daily closes near the highs.
✅ Whether RSI stays above 70, which can happen during strong trends.
✅ Signs of momentum cooling, such as RSI falling back below 70.
✅ Whether price forms a lower high, which could signal weakening demand.
✅ A bearish daily rejection or break of recent support, which would provide stronger evidence that sellers are gaining control.
✅ Check the Weekly chart for nearby support or resistance that could influence the move.
✅ Watch for major central bank, inflation, or labor market news that could quickly change the technical picture.
Risk Considerations
⚠️ Overbought can stay overbought in a strong trend, so entering too early against the move can lead to repeated losses.
⚠️ A small pullback may not signal a reversal. Price can dip, cool off RSI, and then continue higher.
⚠️ Major economic news can cause sudden volatility and quickly override technical signals.
⚠️ If price breaks higher and holds, short-covering can add to the buying pressure and push USD/CHF even higher.
Potential Next Steps
Add USD/CHF to a watchlist and watch whether price can hold above the former 0.8200 swing high after breaking and closing above it.
Technical Analysis
USD/CHF has been trending higher from its August low and has now broken and closed above the previous swing high around 0.8200.
This strengthens the bullish structure and shows buyers have taken control of an important resistance level.
The next test is whether 0.8200 can now act as support. Holding above this level would support another move higher, while a quick drop back below 0.8200 would suggest the breakout is losing strength.
A deeper move into 0.8055–0.8130 would put the recent recovery under more pressure.
Trade Idea: Bullish Continuation Scenario
Setup
The bullish setup is based on USD/CHF holding above the broken 0.8200 swing high. The breakout shows buyers have pushed through an area that previously stopped the rally.
A controlled pullback toward 0.8200 followed by renewed buying would provide another sign that the former resistance has turned into support.
The broader bullish setup remains healthier while price stays above the nearby 0.8055–0.8130 demand zone.
Entry
Consider entering long on a daily close above 0.8265, confirming that buyers are extending the breakout beyond the latest high.
Alternatively, enter on a controlled pullback into 0.8180–0.8200 if price stabilizes there and turns back higher.
If price loses this support area and closes decisively below 0.8130, stand aside and wait for either deeper support to form or a cleaner breakout later.
Stop Loss
For breakout entries: stop on a daily close back below 0.8200. This would invalidate the breakout by showing price could not stay above the former ceiling.
For pullback entries: stop on a daily close below 0.8130. This would invalidate the support-hold idea and show buyers are no longer defending the nearby structure.
Take Profit
Target 0.8500, because this is the next major round-number area above the current structure and a natural longer-term target if the breakout continues to develop.
Bottom Line
The bullish case is strongest while USD/CHF remains above 0.8200. A daily close above 0.8265 would show that buyers are continuing the breakout and could open the way toward 0.8500.
A close back below 0.8200 would weaken the breakout, while a deeper close below 0.8130 would invalidate this bullish setup and put the nearby demand zone at risk.
Trade Idea: Bearish Pullback Scenario
Setup
The bearish scenario becomes more interesting if the current breakout struggles to hold, especially with RSI already in overbought territory.
The first warning would be a rejection around 0.8250–0.8265 followed by price falling back below 0.8200.
For sellers to gain stronger control, USD/CHF would then need to break through the green demand zone around 0.8055–0.8130.
A failure of this area could expose the much lower demand zone around 0.7795–0.7845.
Entry
Consider entering short on a daily close below 0.8055, confirming that the support zone has failed.
Alternatively, if price pushes into 0.8250–0.8265 and prints a clear bearish rejection candle, enter short on the next daily close back below 0.8200.
If price instead breaks and closes decisively above 0.8265, stand aside, as this would invalidate the immediate bearish pullback idea.
Stop Loss
For breakdown entries: stop on a daily close back above 0.8130. This would invalidate the breakdown by showing price has reclaimed the demand zone.
For rejection entries near resistance: stop on a daily close above 0.8265. This would invalidate the bearish idea by confirming buyers have pushed through the latest high.
Take Profit
Target 0.7795–0.7845, because this is the next major green demand zone below the current structure and the most likely area where buyers could try to step back in after a deeper decline.
Bottom Line
The bearish case depends first on USD/CHF failing to hold its breakout above 0.8200. A rejection from 0.8250–0.8265 followed by a close below 0.8200 would be an early sign that buyers are losing momentum.
A daily close below 0.8055 would provide much stronger bearish confirmation and could open the way toward 0.7795–0.7845.
A decisive close above 0.8265 would invalidate the immediate bearish pullback setup.
This content is strictly for informational purposes only and does not constitute as investment advice. Trading any financial market involves risk. Please read our Risk Disclosure to make sure you understand the risks involved.



