


USD/CHF has started to lose momentum after a steady climb through June, and the latest daily candle adds pressure near the recent highs.
A widely followed momentum indicator has just flipped, hinting that the recent upside pace may be fading.
With price now pulling away from the 0.8100–0.8140 area, traders may be watching to see whether this is a routine dip or the start of a deeper unwind.
Welcome to “TA Alert of the Day.” Each day after the market close, MarketMilk scans for popular technical indicator alerts. We use these alerts as the basis for a mini-lesson, breaking down what each alert means, why it matters, and how traders might interpret it. The goal is to help beginner traders not only spot these alerts but also understand the logic behind them and how they can inform trading decisions.
What MarketMilk Has Detected
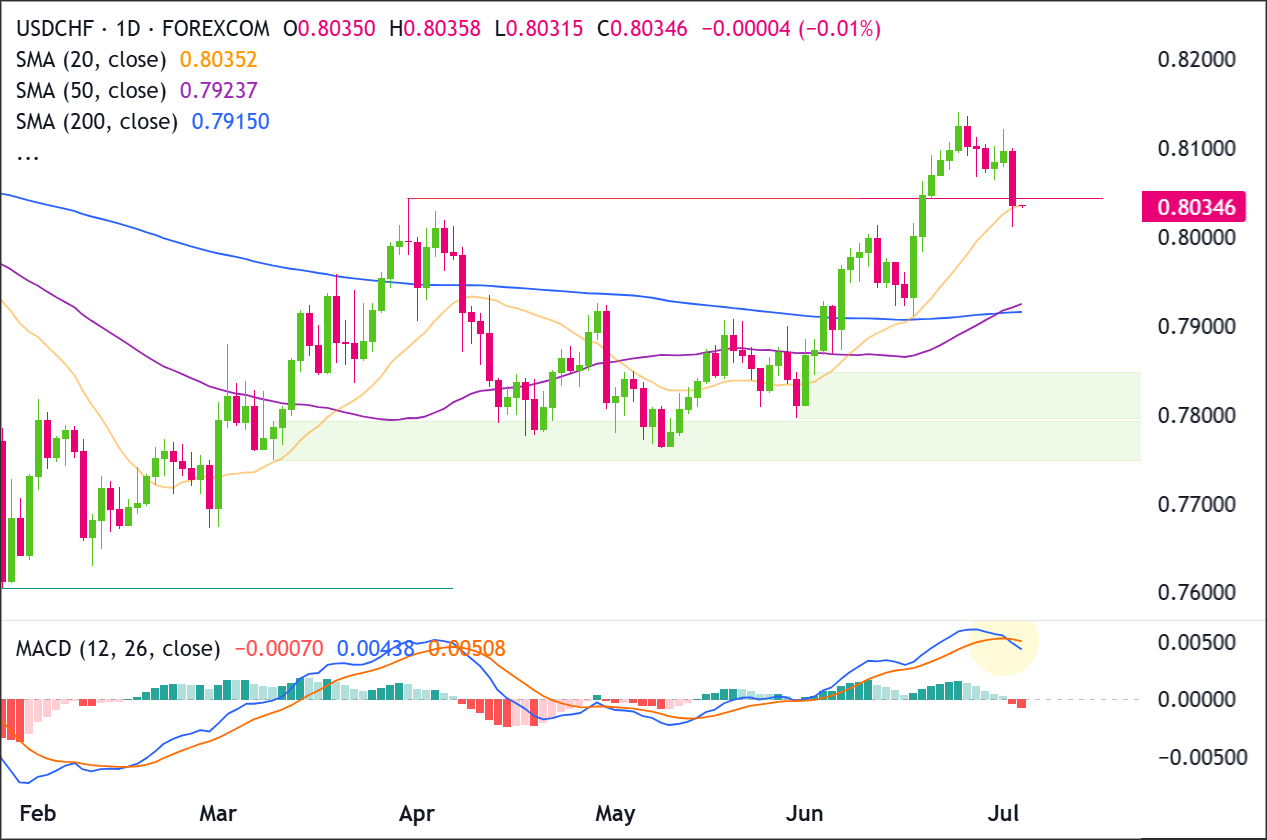
MarketMilk detected a bearish MACD(12,26,9) crossover , where the MACD line moved below its signal line.
This shift happened as USD/CHF slipped to 0.80353, pulling back from the late-June push into the 0.81395 area (recent swing high).
Price transitioned from an April downswing (lows near 0.7790) into a persistent May–June advance that stalled just under mid-0.81s.
From a price-structure perspective, the drop also brings focus to nearby support around 0.8000, with deeper reference support in the 0.7920–0.7950 zone.
What This Signals
A bearish MACD crossover often marks a momentum rollover after an upswing, and it can attract traders looking for signs that buyers are losing control.
When it appears after an extended rise (as seen from late May into late June), it suggests that upside momentum is slowing and that price may be entering a consolidation or pullback phase.
If follow-through selling develops, the market may start revisiting prior breakout zones rather than immediately re-testing the highs.
However, this same pattern can also represent a normal “reset” within an ongoing uptrend.MACD crossovers can occur during shallow pullbacks where prices briefly dip, then resume higher once the market digests gains.
In that case, the crossover may fade quickly if USD/CHF stabilizes above nearby support and reclaims the 0.8090–0.8100 area.
The outcome depends heavily on how price behaves around nearby supports and whether downside momentum persists after the crossover.
Context and confirmation are essential:
- A crossover with weak follow-through can turn into whipsaw.
- A crossover accompanied by expanding downside ranges and repeated support breaks can carry more weight.
How It Works
The MACD (Moving Average Convergence Divergence) measures momentum by comparing two exponential moving averages (typically 12 and 26 periods).
The “signal line” is an EMA (typically 9 periods) of the MACD line.
A bearish crossover occurs when the MACD line crosses below the signal line, indicating that recent price momentum is weakening relative to the prior trend.
Because MACD is derived from moving averages, it is inherently lagging. It tends to confirm that momentum has shifted rather than predicting the turning point in advance.
It’s often most useful when combined with price structure (support/resistance) and trend context.
Important: MACD crossovers can whipsaw in sideways or choppy conditions, and even in trends they may trigger early while price is only starting a pullback. Reliability typically improves when the crossover aligns with clear resistance rejection, a break of support, or broader risk/macro alignment relevant to USD/CHF.
What to Look For Before Acting
Do not assume the crossover guarantees a sustained downside move. Consider these factors:
✅ Whether USD/CHF holds above or breaks below 0.8000 (psychological level and recent swing-area support)
✅ A daily close back below the late-June pivot area around 0.8080–0.8100 vs. a quick reclaim (trap risk)
✅ Follow-through: additional lower highs/lower lows over the next several sessions rather than a one-day drop
✅ The MACD histogram staying negative and expanding (momentum confirming the crossover)
✅ Reaction at the 0.7920–0.7950 zone (prior consolidation area in mid-June)
✅ Whether the prior swing high near 0.81395 remains intact as resistance on any rebound
✅ Alignment on a 4-Hour or Weekly view (trend structure and whether this is a pullback vs. a larger reversal attempt)
✅ USD/CHF sensitivity to upcoming macro drivers (e.g., US data surprises, risk sentiment shifts, and CHF safe-haven demand)
Risk Considerations
⚠️ Whipsaw risk: MACD crossovers can flip back quickly if price returns to a range
⚠️ Support bounce risk: 0.8000 is nearby and can spark sharp mean-reversion moves
⚠️ Event risk: USD/CHF can gap or spike around macro releases, overriding indicator signals
⚠️ Trend-context risk: the broader May–June move was upward; countertrend signals can fail without clean structure breaks
Potential Next Steps
Consider keeping USD/CHF on a watchlist and monitoring how price behaves around 0.8000 and the 0.8080–0.8100 area.
USD/CHF is pulling back after a strong breakout run into the 0.8120-0.8140 area. Price is now testing the prior breakout zone near 0.8040, which also lines up closely with the 20-day SMA.
The broader structure is not fully bearish yet because the 50-day SMA at 0.7924 and 200-day SMA at 0.7915 remain below price and form a key support cluster around 0.7915-0.7925.
Recent price action shows the recent rally into 0.8120-0.8140 lost momentum, and sellers have now pushed price back below the prior swing-high breakout area near 0.8040.
That makes the current pullback more important: buyers need to quickly reclaim 0.8045-0.8050 to repair the failed breakout attempt, while sellers need a break below 0.8000 to confirm that the move is turning into a deeper pullback toward 0.7900-0.7850.
Trade Idea: Bullish Continuation Scenario
Setup
The bullish setup depends on USD/CHF holding the 0.8000-0.8035 support area and reclaiming momentum above 0.8050.
If buyers defend this zone, the current move can still be treated as a retest of the breakout rather than a full trend failure.
A daily close back above 0.8050 would suggest buyers are regaining control and could open the door for a retest of 0.8120-0.8140.
Entry
Consider entering long on a daily close above 0.8050, confirming that buyers are breaking out of the recent structure.
Alternatively, enter on a controlled pullback into 0.8000-0.8035 if price stabilizes there and turns back higher.
If price loses that support zone and closes decisively below 0.8000, stand aside and wait for either deeper support to form or a cleaner breakout later.
Stop Loss
For breakout entries: stop on a daily close back below 0.8035. That would invalidate the breakout by showing price could not stay above the former ceiling.
For pullback entries: stop on a daily close below 0.8000. That would invalidate the support-hold idea and show buyers are no longer defending the zone.
Take Profit
Target 0.8120-0.8140, because that is the next clear upside area on the chart and the most natural place for price to retest if the current recovery continues.
Bottom Line
The bullish case stays alive if USD/CHF holds the 0.8000-0.8035 support zone and reclaims 0.8050 on a daily closing basis. That would suggest the recent weakness is only a breakout retest.
A confirmed move above 0.8050 puts 0.8120-0.8140 back in focus. The bullish idea weakens if price closes below 0.8000, especially with momentum already cooling.
Trade Idea: Bearish Pullback Scenario
Setup
The bearish setup is based on USD/CHF failing at the 0.8035-0.8050 resistance/support flip zone after the recent rally lost momentum.
If price can’t reclaim 0.8050 and instead breaks below 0.8000, sellers would have a stronger case for a deeper pullback toward the moving-average cluster around 0.7920-0.7925.
Entry
Consider entering short on a daily close below 0.8000, confirming that the support zone has failed.
Alternatively, if price pushes into 0.8035-0.8050 and prints a clear bearish rejection candle, enter short on the next daily close back below 0.8035.
If price instead breaks and closes decisively above 0.8050, stand aside, as that would invalidate the bearish pullback idea.
Stop Loss
For breakdown entries: stop on a daily close back above 0.8035. That would invalidate the breakdown by showing price has reclaimed the support zone.
For rejection entries near resistance: stop on a daily close above 0.8050. That would invalidate the bearish idea by confirming buyers have pushed through resistance.
Take Profit
Target 0.7915-0.7925, because that is the next major support area below the current structure and the most likely place where buyers would try to step back in.
Bottom Line
The bearish case strengthens if USD/CHF fails below the 0.8035-0.8050 zone and closes under 0.8000. That would confirm the breakout retest has failed and shift attention toward deeper support.
A breakdown below 0.8000 targets 0.7920-0.7925. The bearish idea is invalidated if price reclaims 0.8050 with a decisive daily close.
This content is strictly for informational purposes only and does not constitute as investment advice. Trading any financial market involves risk. Please read our Risk Disclosure to make sure you understand the risks involved.


