


USD/CAD has moved pretty far, pretty fast, which could make short-term traders take another look at their positioning.
The latest daily close shows just how strong the recent push has been, with price now stretched beyond its usual range.
After a move like this, the market can sometimes shift from chasing the trend to locking in profits.
The next few sessions should help show whether this momentum has more room to run or whether the move is starting to fade.
Welcome to “TA Alert of the Day.” Each day after the market close, MarketMilk scans for popular technical indicator alerts. We use these alerts as the basis for a mini-lesson, breaking down what each alert means, why it matters, and how traders might interpret it. The goal is to help beginner traders not only spot these alerts but also understand the logic behind them and how they can inform trading decisions.
What MarketMilk Has Detected
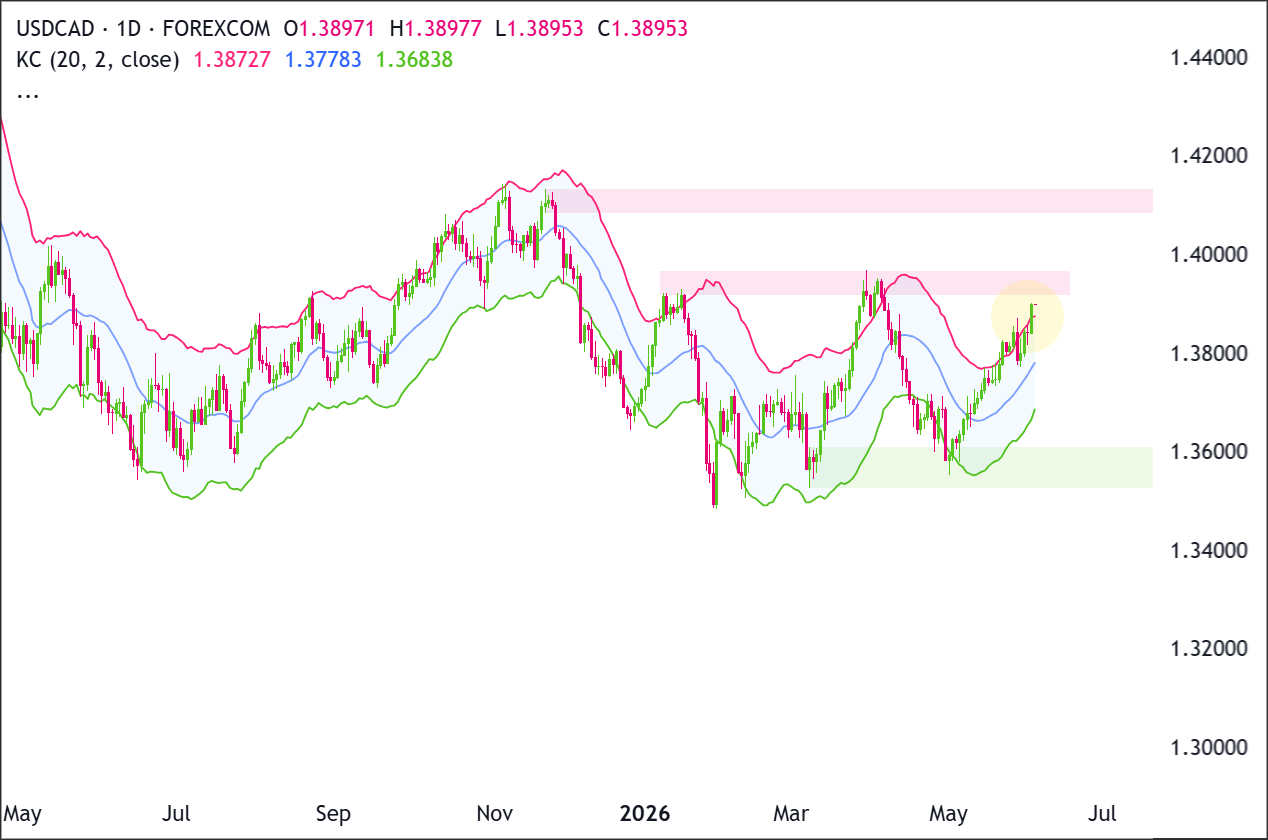
USD/CAD has closed above the upper Keltner Channel on the daily timeframe.
Price spent much of April trading lower (down toward the 1.36–1.37 area), before rebuilding momentum through May and pressing into the 1.38s.
USD/CAD is near a historically active resistance zone around 1.389–1.394, where late-March/early-April trading previously peaked.
What This Signals
Traditionally, a close above the upper Keltner Channel can attract attention as a sign of overextended momentum.
In many market conditions, that type of extension often marks a point where upside progress becomes harder to sustain without consolidation.
And where mean-reversion traders look for price to rotate back toward the channel’s middle line (the average).
However, this same pattern can also represent trend strength rather than exhaustion, especially when price begins to “walk the band,” closing near or above the upper channel for multiple sessions.In that scenario, what looks stretched can simply be persistent demand, and attempts to fade the move can run into follow-through buying.
The outcome depends heavily on follow-through versus rejection around the breached band, as well as how USD/CAD behaves near nearby reference levels from prior swing highs.
How It Works
Keltner Channels are volatility-based envelopes plotted around a moving average.
The middle line is typically an average of price, while the upper and lower bands are set a certain multiple of volatility (commonly ATR) above and below that average.
When price reaches or exceeds the upper band, it indicates that the current move is unusually strong relative to recent volatility.
Because the channel adapts to changing volatility, a breach can mean either:
- Price has become temporarily extended and may revert toward the mean.
- Volatility is expanding in the direction of the trend and price is transitioning into a stronger impulse phase.
Important: A single close above the upper band is not, by itself, a reversal signal. Reliability tends to improve when the breach is followed by rejection (failure to hold above the band), or when it occurs into well-defined resistance where previous rallies stalled.
What to Look For Before Acting
Do not assume the upper-band breach guarantees a bearish reversal. Consider these factors:
✅ Whether USD/CAD can hold above ~1.3888 (the breached upper band) for more than one session, or quickly falls back inside the channel
✅ Evidence of rejection (e.g., an upper wick/weak close) near 1.3900–1.3945, a zone that previously capped advances in late March
✅ A pullback that finds support near the Keltner middle line (currently around 1.3783) versus a deeper drop toward 1.374–1.372 (late-May congestion)
✅ Whether prior breakout area around 1.382–1.385 acts as support on any retest (bullish behavior) or fails quickly (bearish behavior)
✅ Daily structure: a lower high followed by a lower close would better support a mean-reversion interpretation
✅ Alignment on the Weekly timeframe: is price pressing into longer-term resistance, or breaking into fresh territory?
✅ Volatility conditions: expanding ranges can keep price elevated near the upper band longer than expected
✅ Macro catalysts relevant to USD/CAD (e.g., upcoming central-bank messaging, inflation/labor data, oil sensitivity) that could sustain or unwind the move
Risk Considerations
⚠️ Trend persistence risk: price can “ride” the upper channel and stay extended longer than mean-reversion traders expect
⚠️ False reversal risk: an initial dip back inside the channel can be followed by a quick re-break higher
⚠️ Resistance isn’t exact: the 1.389–1.394 zone may be overshot before any meaningful response appears
⚠️ Event-driven gaps: major data/central-bank headlines can invalidate volatility-band signals quickly
Potential Next Steps
Keep USD/CAD on a watchlist for confirmation behavior after the upper Keltner channel breach, especially whether price rejects the 1.3900–1.3940 area or instead consolidates above it.
Recent candles show buyers pushing price higher after defending the 1.3530-1.3680 support zone, but price is now approaching resistance at 1.3920-1.3960.
Buyers need a daily close above 1.3960 to confirm continuation, while sellers need price to reject this zone and lose 1.3778 to shift momentum back lower.
Trade Idea: Bullish Continuation Scenario
Setup
The bullish setup is based on USD/CAD holding above the near-term support area around 1.3778-1.3800 and breaking through the resistance zone at 1.3920-1.3960.
A daily close above 1.3960 would show buyers are taking control of the recent structure and opening the door toward the next resistance zone near 1.4080-1.4130.
Entry
Consider entering long on a daily close above 1.3960, confirming that buyers are breaking out of the recent structure.
Alternatively, enter on a controlled pullback into 1.3778-1.3800 if price stabilizes there and turns back higher.
If price loses that support zone and closes decisively below 1.3680, stand aside and wait for either deeper support to form or a cleaner breakout later.
Stop Loss
For breakout entries: stop on a daily close back below 1.3920. That would invalidate the breakout by showing price could not stay above the former ceiling.
For pullback entries: stop on a daily close below 1.3680. That would invalidate the support-hold idea and show buyers are no longer defending the zone.
Take Profit
Target 1.4100, because that is the next clear upside area on the chart and the most natural place for price to retest if the current recovery continues.
Bottom Line
The bullish case improves if USD/CAD closes above 1.3960 and holds that breakout.
That would confirm strength through the current resistance zone and create a reasonable path toward 1.4100.
The key invalidation level is 1.3680. A daily close below 1.3680 would weaken the recovery structure and suggest the bullish continuation setup is no longer clean.
Trade Idea: Bearish Pullback Scenario
Setup
The bearish setup is based on USD/CAD failing at the 1.3900-1.3940 resistance zone after a sharp recovery.
If price rejects that area and then loses 1.3778, sellers would have a stronger case for a pullback toward the broader support zone around 1.3530-1.3680.
Entry
Consider entering short on a daily close below 1.3778, confirming that the support zone has failed.
Alternatively, if price pushes into 1.3920-1.3960 and prints a clear bearish rejection candle, enter short on the next daily close back below 1.3873.
If price instead breaks and closes decisively above 1.3960, stand aside, as that would invalidate the bearish pullback idea.
Stop Loss
For breakdown entries: stop on a daily close back above 1.3800. That would invalidate the breakdown by showing price has reclaimed the support zone.
For rejection entries near resistance: stop on a daily close above 1.3960. That would invalidate the bearish idea by confirming buyers have pushed through resistance.
Take Profit
Target 1.3530-1.3680, because that is the next major support area below the current structure and the most likely place where buyers would try to step back in.
Bottom Line
The bearish case depends on USD/CAD failing at 1.3920-1.3960 and then closing below 1.3778.
That would show the recovery is losing momentum and could trigger a pullback into the broader support zone.
The downside target is 1.3530-1.3680, while a daily close above 1.3960 would invalidate the bearish pullback setup and favor continuation higher.
This content is strictly for informational purposes only and does not constitute as investment advice. Trading any financial market involves risk. Please read our Risk Disclosure to make sure you understand the risks involved.


