





USD/CAD is back near recent highs after weeks of steady gains, but the latest push is starting to test how much momentum buyers have left.
Price is pressing into an area that has recently capped the advance, while momentum has once again reached an extreme.
If buyers can keep pushing through resistance, the rally could have more room to run. If they struggle, a pullback may start to take shape.
Welcome to “TA Alert of the Day.” Each day after the market close, MarketMilk scans for popular technical indicator alerts. We use these alerts as the basis for a mini-lesson, breaking down what each alert means, why it matters, and how traders might interpret it. The goal is to help beginner traders not only spot these alerts but also understand the logic behind them and how they can inform trading decisions.
What MarketMilk Has Detected
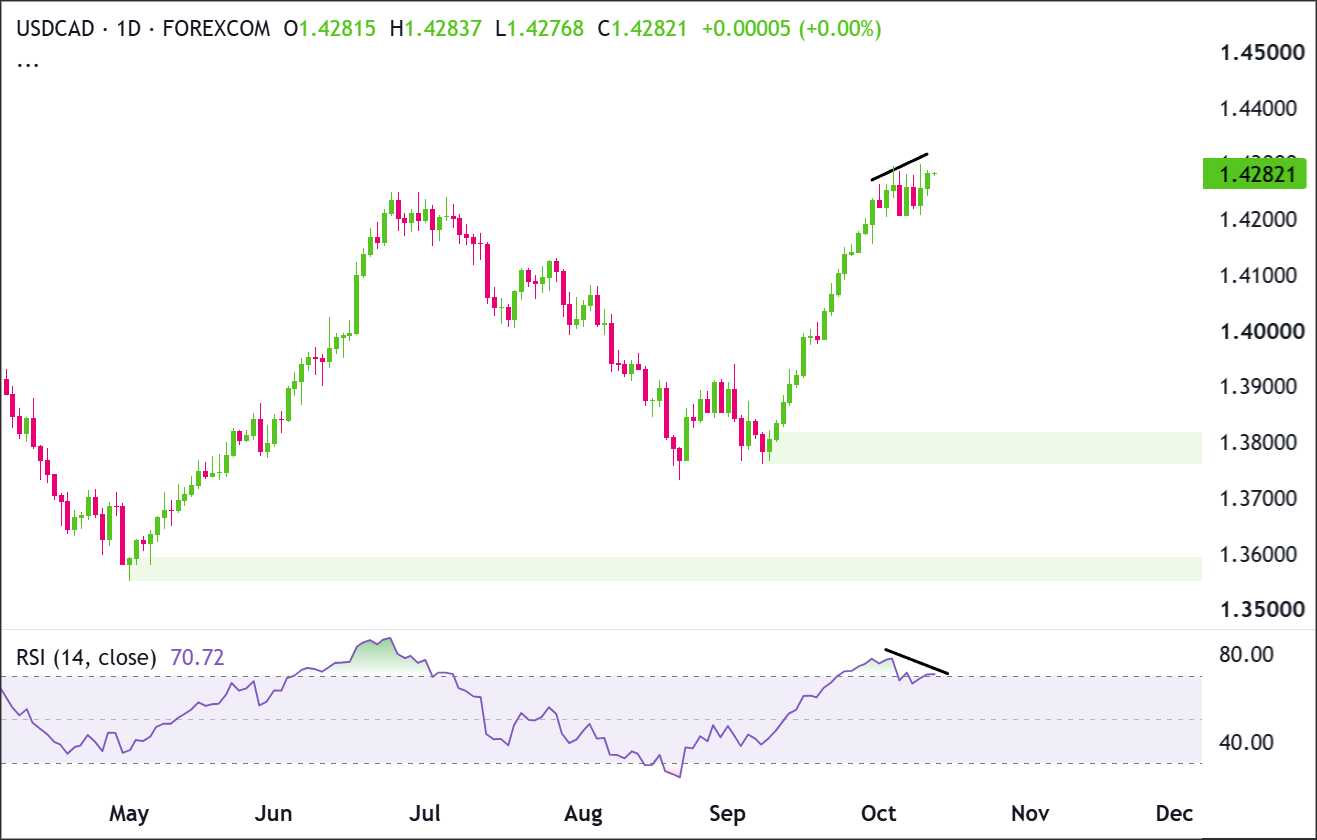
USD/CAD’s daily RSI(14) has moved back into overbought territory, rising to about 71 after crossing above the 70 level.
What This Signals
An RSI reading above 70 often suggests that buying momentum is running hot, but it doesn’t automatically mean USD/CAD is ready to reverse.
If price keeps struggling around 1.4280 to 1.4290 and RSI falls back below 70, that could point to fading upside momentum and raise the chance of a pullback.
But if USD/CAD breaks above recent highs and holds there, the overbought reading may simply be confirming a strong uptrend.RSI can stay elevated for a while when buyers remain in control.
A pullback would also be worth watching for how price behaves near 1.4207. Holding above this area could keep the broader bullish structure intact, while a clearer break below it would suggest the recent rally is losing more traction.
The signal is best treated as a warning that momentum is elevated, not proof that a reversal is coming.
How It Works
The Relative Strength Index (RSI) is a momentum indicator that measures the strength of recent price moves on a scale from 0 to 100.
Readings above 70 are commonly considered overbought, while readings below 30 are considered oversold.
An overbought reading tells you that buying momentum has been strong. It can sometimes appear before a pullback, especially near resistance, but it can also stay elevated while a strong uptrend continues.
That’s why RSI works best as a setup or confirmation tool rather than an automatic sell signal!
Watching how price behaves around support and resistance can help you judge whether momentum is actually starting to weaken.
What to Look For Before Acting
Don’t treat the overbought RSI reading as an automatic sell signal. Instead, look for confirmation from price and momentum.
✅ A daily close back below 1.4250 to 1.4260, which could suggest rejection from recent highs.
✅ RSI(14) falling back below 70, showing that upside momentum is starting to cool.
✅ A lower high forming near 1.4280 to 1.4290, which could point to buyers losing some control.
✅ A clear break above 1.4290, which would weaken the bearish setup and suggest momentum may still favor buyers.
✅ How price behaves near 1.4207 if a pullback develops, since holding this area could keep the broader uptrend intact.
✅ A break below 1.4207, which would provide stronger evidence that the recent rally is losing traction.
✅ Higher-timeframe structure, especially whether USD/CAD is still making higher highs and higher lows.
✅ Upcoming U.S. or Canadian economic events that could quickly shift momentum or trigger volatility.
Risk Considerations
⚠️ RSI can stay overbought: If USD/CAD keeps holding above 1.4250 and pushing toward new highs, avoid assuming the signal must lead to a pullback.
⚠️ Resistance can break: A sustained move above 1.4290 would weaken the bearish setup and could expose you to a fast move higher.
⚠️ Shallow pullbacks can be misleading: A dip that holds above 1.4207 may simply be a pause within the broader uptrend rather than the start of a deeper decline.
⚠️ Event risk can override the signal: U.S. or Canadian data, central bank comments, or sharp oil moves can quickly invalidate a technical setup.
⚠️ Volatility near recent highs can cause whipsaws: If price is swinging sharply around 1.4280 to 1.4290, wait for clearer confirmation rather than reacting to a single candle.
Potential Next Steps
Add USD/CAD to a watchlist and watch how price behaves around 1.4200–1.4300. USD/CAD has rallied strongly over the past several weeks, but the move’s starting to look less convincing near the recent highs.
RSI has already reached overbought territory, and there’s now a bearish divergence between price and RSI.
This doesn’t mean price has to fall, but it’s a reason to watch for signs that buyers may be losing some strength.
A clear break above 1.4300 would keep the bullish move going, while a break below 1.4200 would be an early sign that a pullback may be starting.
Price Action Analysis
Price recently made a higher high, but RSI made a lower high. This creates a bearish divergence and suggests buying momentum isn’t as strong as it was during the previous push higher.
The recent candles near 1.4250–1.4300 are also smaller and more mixed than the candles during the September rally. This shows that price has slowed down near the highs.
Buyers now need to push USD/CAD above 1.4300 and keep it there.
Sellers need price to fall back below 1.4200 before there’s stronger evidence that the current rally is turning into a deeper pullback.
Trade Idea: Bullish Scenario
Setup
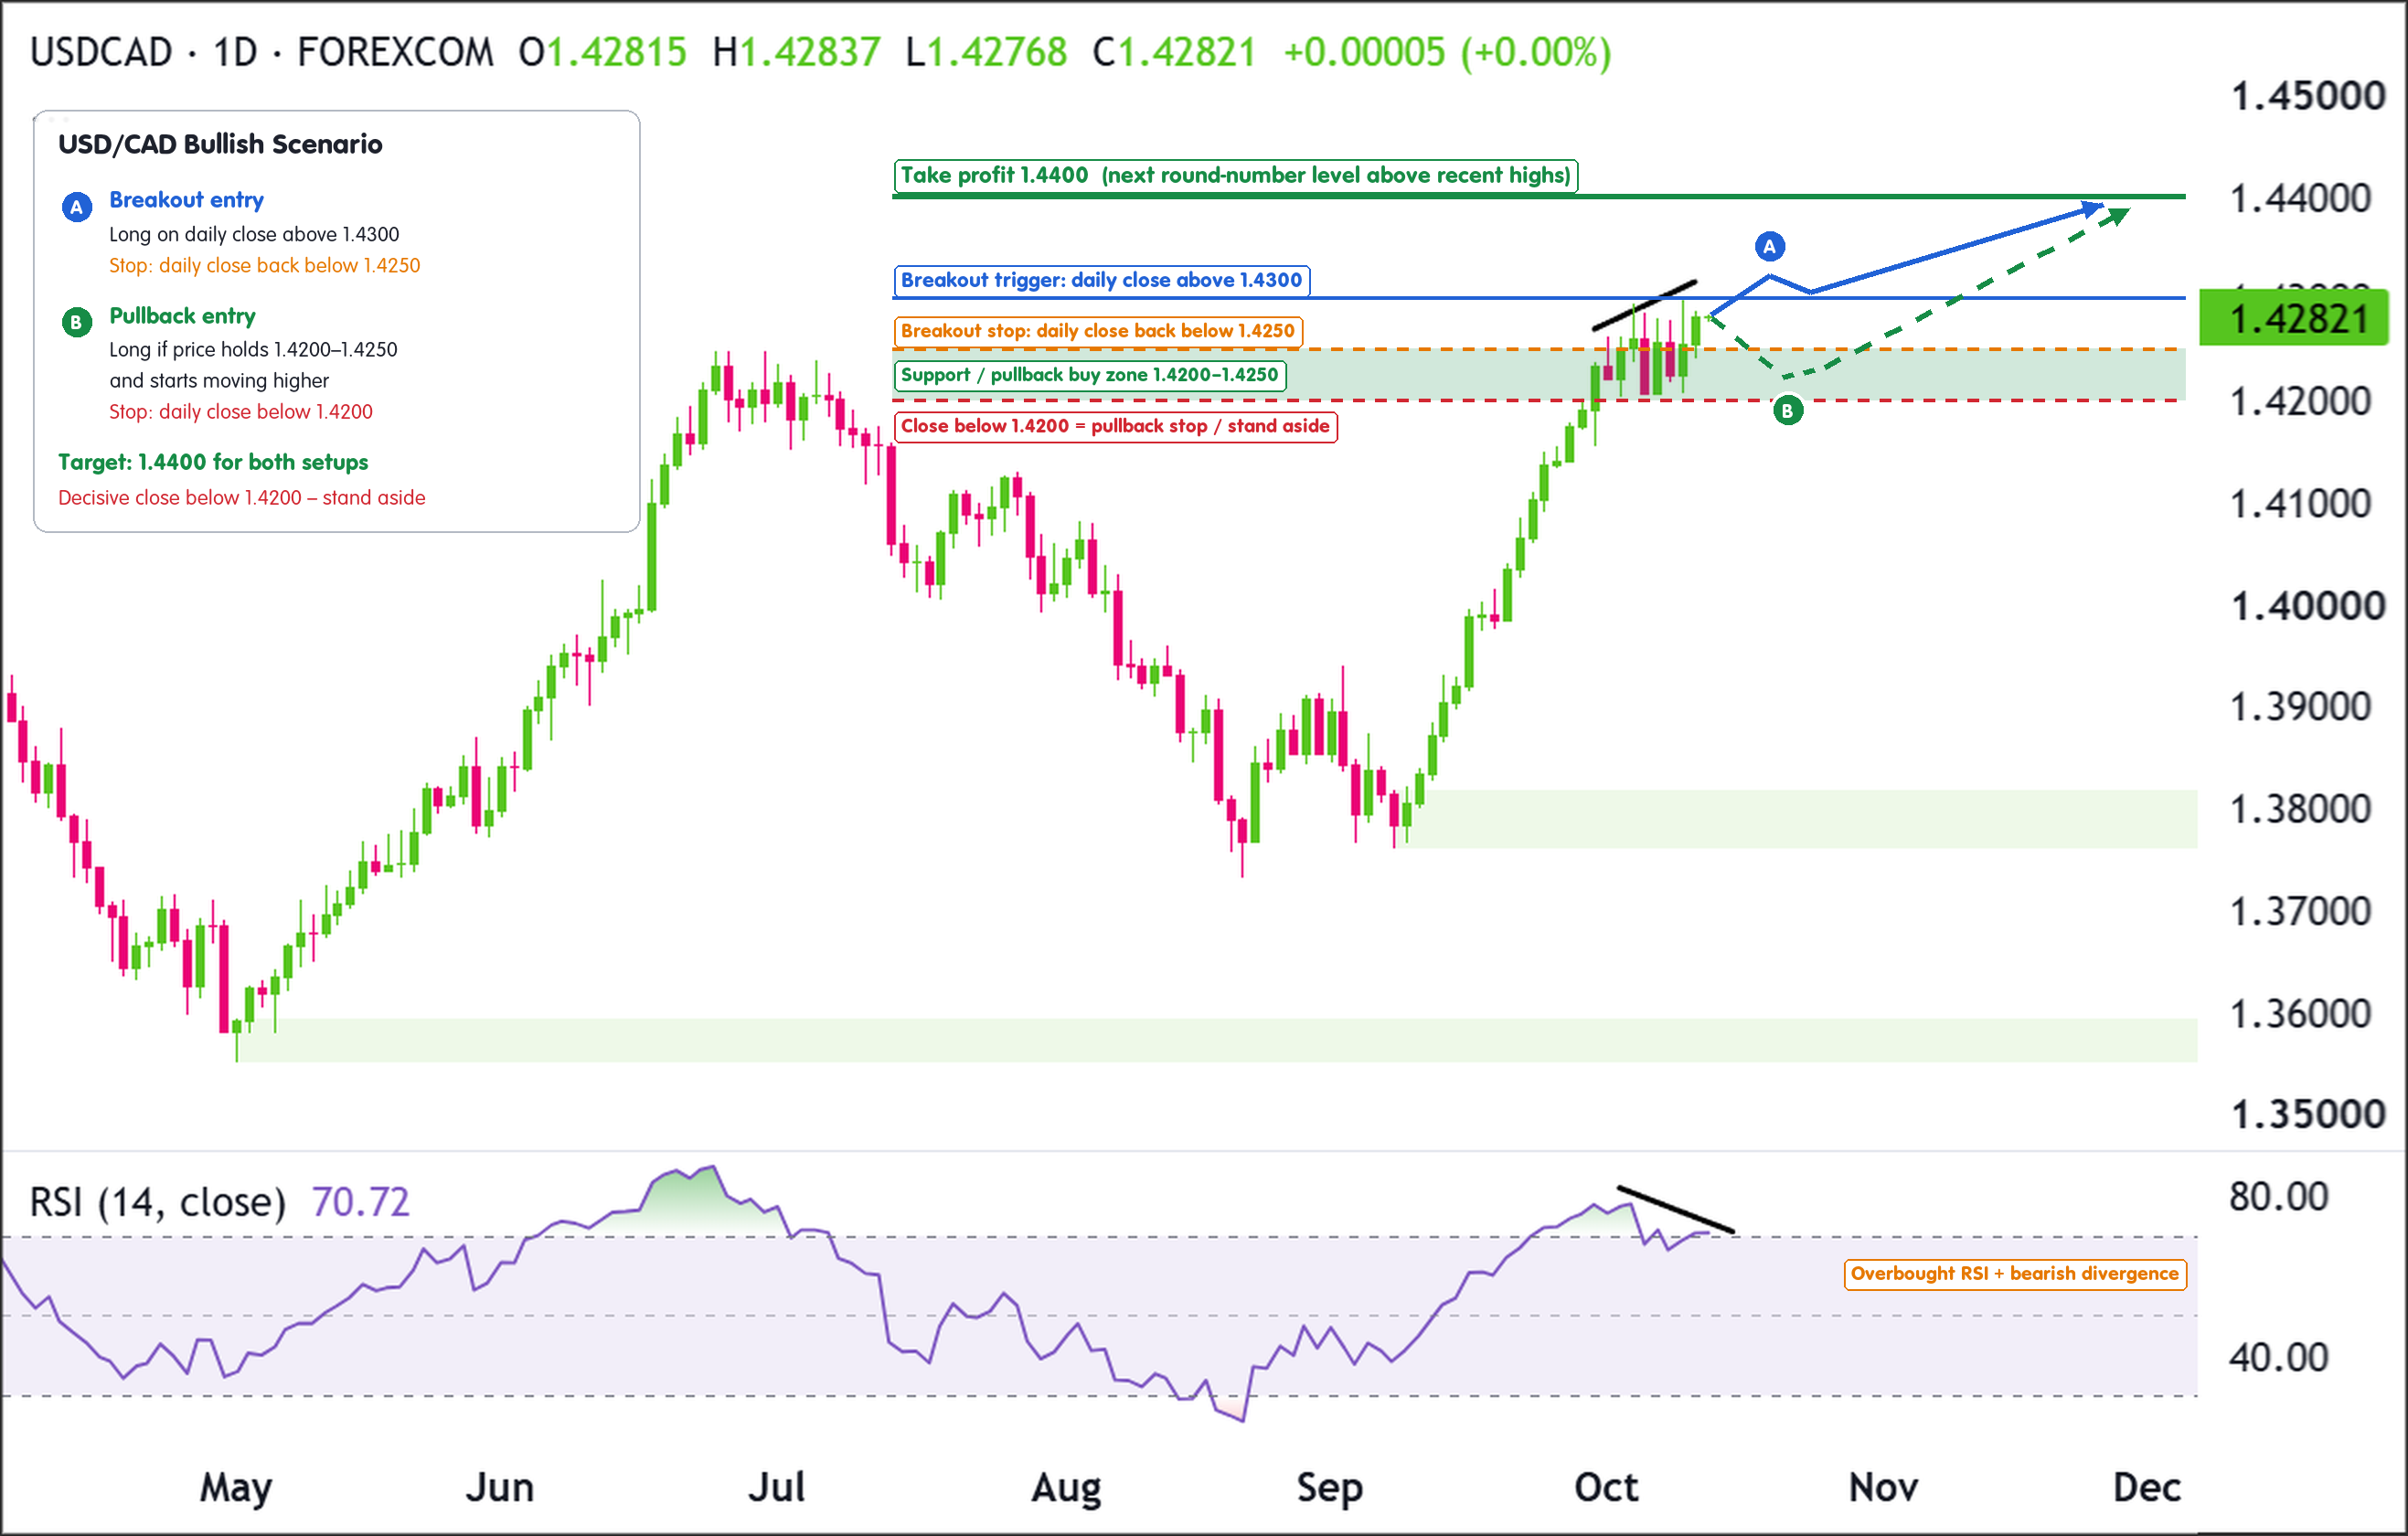
The bullish setup is fairly simple. USD/CAD needs to keep holding the 1.4200–1.4250 area and then break above 1.4300.
A daily close above 1.4300 would show buyers are still in control despite the overbought RSI reading and bearish divergence.
A pullback into 1.4200–1.4250 could also create another opportunity if buyers step back in and price turns higher.
Entry
Consider entering long on a daily close above 1.4300, confirming buyers are breaking above the recent highs.
Alternatively, enter on a controlled pullback into 1.4200–1.4250 if price stabilizes there and starts moving higher again.
If price loses this support area and closes decisively below 1.4200, stand aside and wait for either deeper support to form or a cleaner breakout later.
Stop Loss
For breakout entries: stop on a daily close back below 1.4250. This would show price couldn’t stay above the previous high and the breakout has failed.
For pullback entries: stop on a daily close below 1.4200. This would invalidate the bullish setup because buyers would no longer be holding the nearby support area.
Take Profit
Target 1.4400. This is the next clear “round number” area above the recent highs and would be a natural place for price to pause if the breakout continues.
Bottom Line
The bullish case becomes stronger if USD/CAD closes above 1.4300. This would open the door for a move toward 1.4400.
A pullback into 1.4200–1.4250 could also work if buyers defend the area and price turns higher again. A daily close below 1.4200 would invalidate the bullish setup.
Trade Idea: Bearish Scenario
Setup
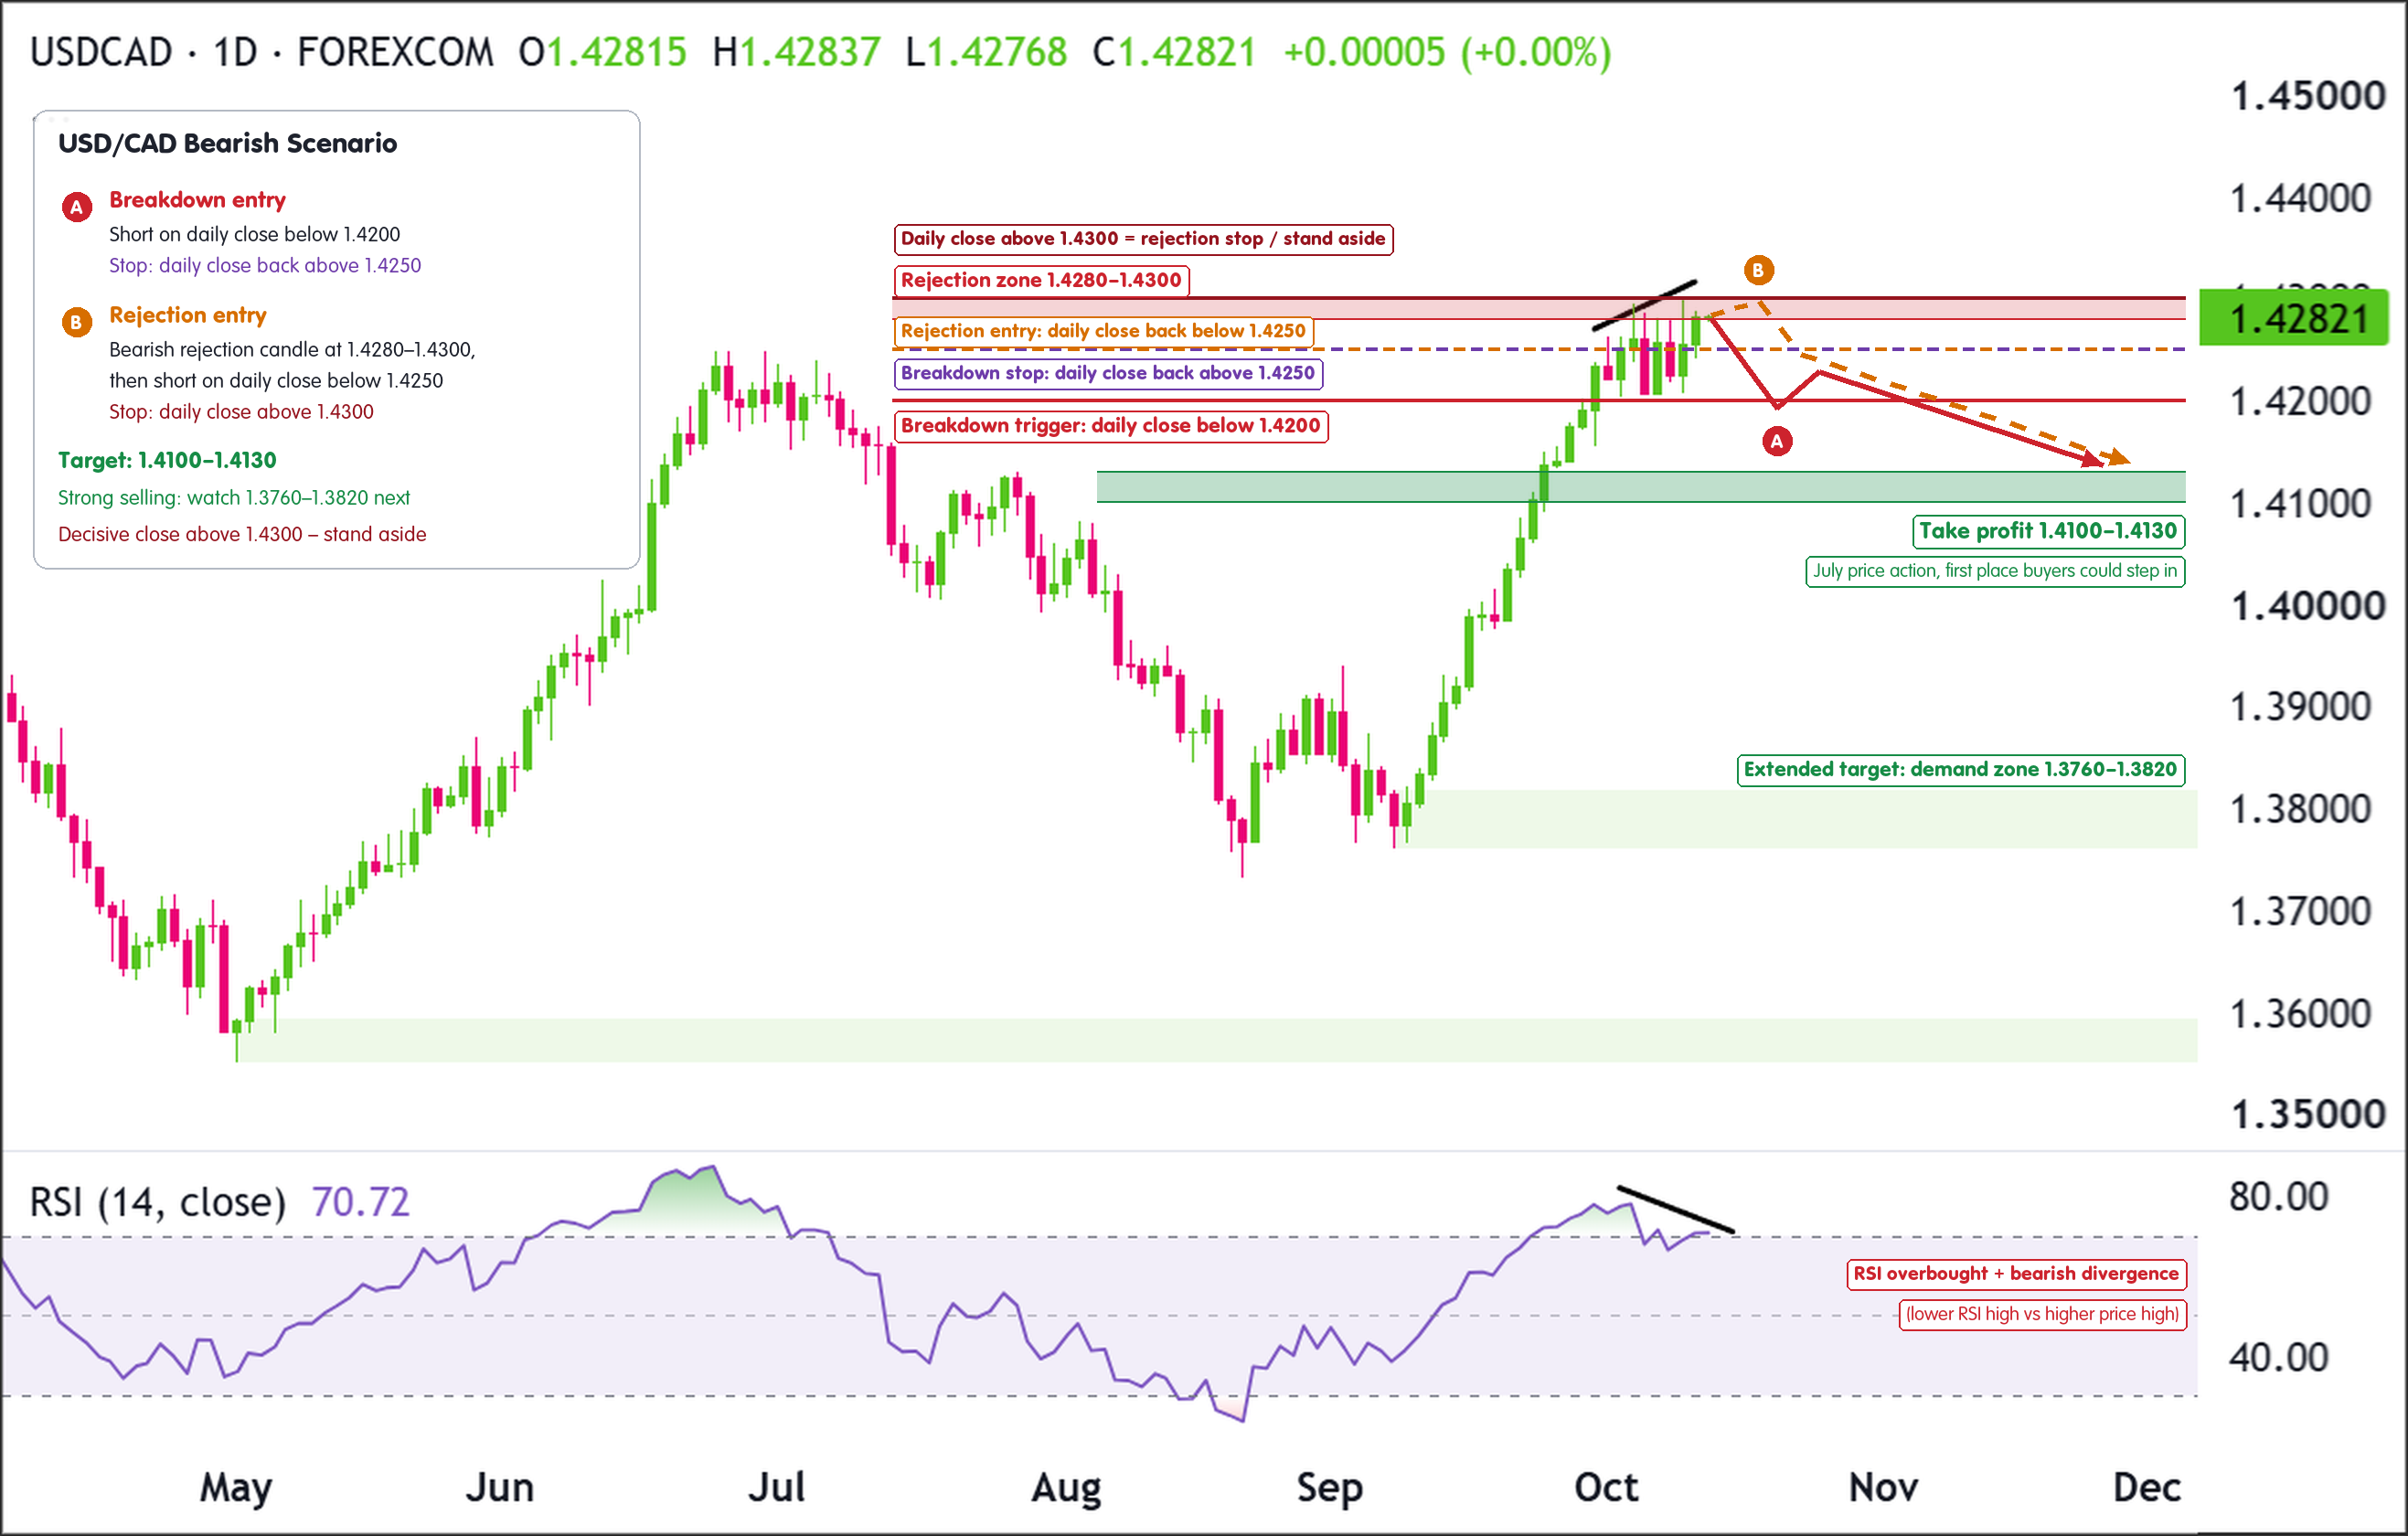
The bearish setup is based on the possibility that USD/CAD is starting to run out of momentum near 1.4280–1.4300.
RSI has reached overbought territory, and the bearish divergence shows RSI is weakening even though price has made a higher high.
Sellers still need confirmation, though. The first important sign would be price falling back below 1.4200.
Entry
Consider entering short on a daily close below 1.4200, confirming nearby support has failed.
Alternatively, if price pushes into 1.4280–1.4300 and forms a clear bearish rejection candle, enter short on the next daily close back below 1.4250.
If price instead breaks and closes decisively above 1.4300, stand aside. This would invalidate the bearish setup by showing buyers are still strong enough to push through resistance.
Stop Loss
For breakdown entries: stop on a daily close back above 1.4250. This would show price has moved back above the broken support area.
For rejection entries near resistance: stop on a daily close above 1.4300. This would invalidate the bearish setup because buyers would’ve broken through the recent highs.
Take Profit
Target 1.4100–1.4130. This area lines up with previous price action from July and is one of the first places where buyers could step back in during a pullback.
If selling becomes much stronger, the larger green demand zone around 1.3760–1.3820 would become an important area to watch next.
Bottom Line
The bearish case becomes stronger if USD/CAD struggles around 1.4280–1.4300 and then falls below 1.4200. The first downside target would be 1.4100–1.4130.
The bearish divergence and overbought RSI support the idea of a possible pullback, but sellers still need price confirmation.
A daily close above 1.4300 would invalidate the bearish setup.
This content is strictly for informational purposes only and does not constitute as investment advice. Trading any financial market involves risk. Please read our Risk Disclosure to make sure you understand the risks involved.



