





USD/CAD is back on the defensive after topping out near 1.4250 and sliding toward the closely watched 1.3990–1.4020 support zone.
Sellers appear to have the upper hand for now, but with price sitting near an area where buyers previously stepped in, the next move could get interesting.
Will the bears force a clean breakdown, or will the bulls defend the big 1.4000 neighborhood and launch a rebound?
Welcome to “TA Alert of the Day.” Each day after the market close, MarketMilk scans for popular technical indicator alerts. We use these alerts as the basis for a mini-lesson, breaking down what each alert means, why it matters, and how traders might interpret it. The goal is to help beginner traders not only spot these alerts but also understand the logic behind them and how they can inform trading decisions.
What MarketMilk Has Detected
MarketMilk detected a bearish MACD cross below the zero line.
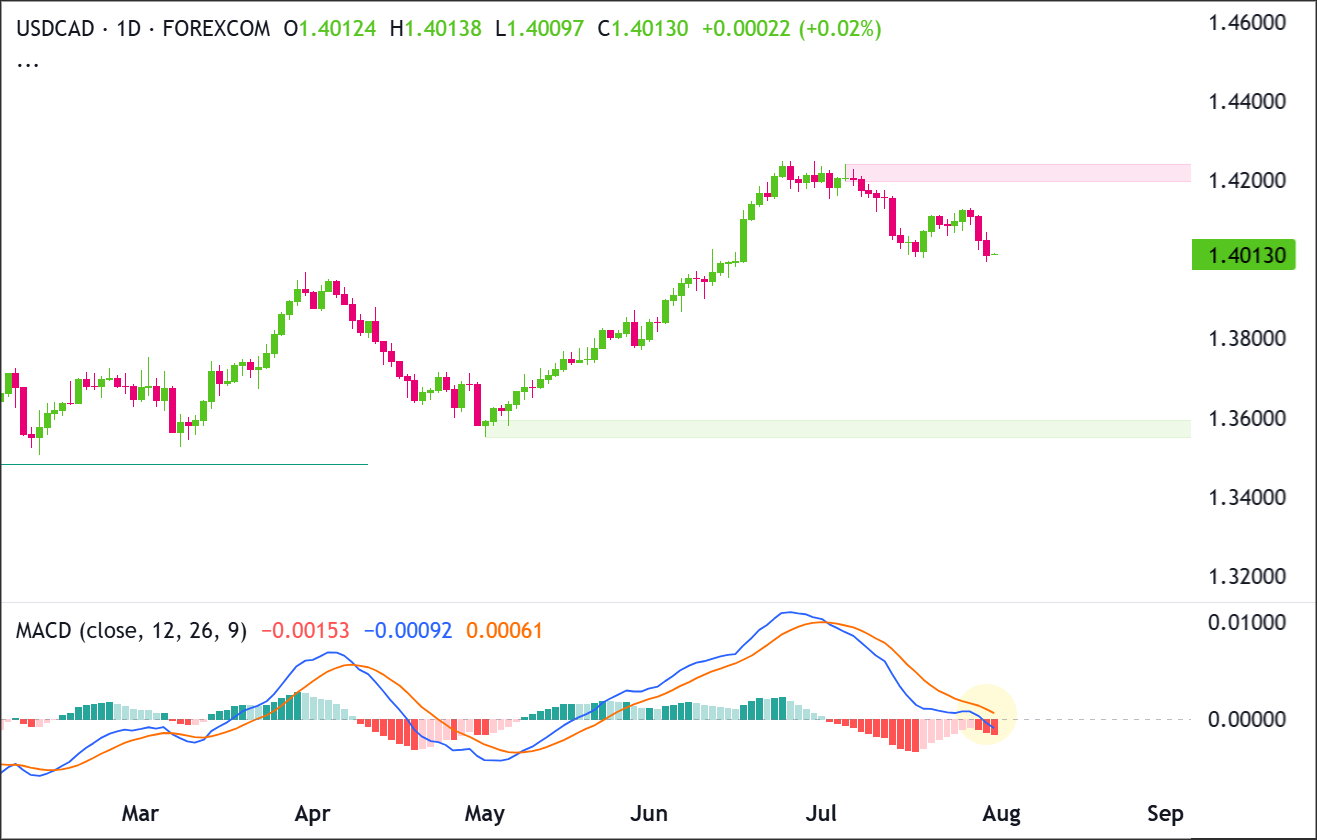
This matters because the zero line is commonly used as a regime filter: above zero often aligns with bullish momentum, while below zero indicates bearish momentum is taking over.
What This Signals
Traditionally, a MACD cross below zero suggests that downside momentum is becoming dominant versus the longer-term baseline, and it can attract trend-following participation if price action confirms.
In many cases, it often marks a transition from “pullback within an uptrend” into a more sustained corrective phase if the move is sustained beneath prior support.
However, this same pattern can also represent a late confirmation after much of the selling has already occurred, particularly when price is testing a well-defined support area.In that scenario, the cross below zero sometimes coincides with a bear trap where prices briefly dip, momentum looks negative, and then USD/CAD snaps back toward the prior breakdown region (such as 1.405–1.412).
Alternatively, if USD/CAD is still in a broader uptrend that is merely consolidating, the negative MACD regime can be temporary.
Especially if buyers defend the 1.399–1.402 base and reclaim recent pivots quickly.
That would keep the signal in the “correction within a larger structure” bucket rather than confirming a deeper shift.
The outcome depends heavily on follow-through candles, how price behaves around 1.399–1.402 support, and whether rebounds stall beneath 1.410–1.412.
Context and confirmation are essential, particularly because MACD is a lagging indicator and can whipsaw when markets transition into ranges.
How It Works
The MACD (Moving Average Convergence Divergence) compares two exponential moving averages (typically 12 and 26 periods) to measure momentum and trend direction, and it uses a 9-period signal line to help interpret turns in momentum.
When the MACD line crosses below the zero line, it means the shorter-term EMA has moved below the longer-term EMA, indicating that recent price action is weakening relative to the longer-term average.Because it’s built from moving averages, MACD tends to confirm shifts rather than predict them.
That’s why traders often pair a zero-line cross with market structure (support/resistance), candle closes, and multi-day follow-through to judge whether the momentum shift is truly taking hold.
Important: A zero-line cross is not a guarantee of continuation. In choppy conditions, MACD can flip around the zero line and generate false regime changes. Reliability generally improves when the cross aligns with a clean break of support and when pullbacks fail at former support turned resistance.
What to Look For Before Acting
Do not assume USD/CAD will continue falling. Consider these factors:
✅ A daily close holding below the 1.399–1.402 support area (not just an intraday dip)
✅ A retest failure: price bounces toward 1.405–1.412 and then stalls or reverses
✅ MACD histogram staying negative and expanding (momentum acceleration rather than a shallow dip)
✅ Whether prior swing support near 1.404–1.406 flips into resistance on any rebound
✅ Alignment on the Weekly structure (e.g., lower highs/lower lows developing more clearly)
✅ Volatility behavior: wider daily ranges after the breakdown can indicate sellers are in control
✅ CAD drivers and event risk (e.g., upcoming BoC/Fed communication, inflation/labor prints) that could amplify or negate technical follow-through
✅ Cross-market confirmation: broad USD tone and oil sensitivity (often relevant to CAD) matching the move
Risk Considerations
⚠️ Whipsaw risk near the zero line: MACD can flip back quickly if USD/CAD rebounds into a range
⚠️ Support bounce risk: the 1.399–1.402 zone is being tested and can trigger short-covering rallies
⚠️ Lagging confirmation: MACD may confirm weakness after a sizable portion of the move has already happened
⚠️ Event-driven gaps: macro releases can override indicator signals and cause abrupt reversals
Price Action Analysis
The last completed daily candle extended the decline after the rebound failed around 1.4095–1.4120.
Price is now pressing the prior swing-low region at 1.3990–1.4030, leaving the market vulnerable to a bearish continuation.
Sellers need a decisive close below 1.3990, while buyers need to defend this area and reclaim 1.4120 to repair the short-term structure.
Trade Idea: Bullish Continuation Scenario
Setup
The bullish scenario depends on the 1.3990–1.4030 support zone holding and attracting renewed buying.
A recovery above the recent lower-high area at 1.4095–1.4120 would indicate that the pullback is losing control. A confirmed breakout above 1.4120 would expose the 1.4190–1.4240 supply zone.
Entry
Consider entering long on a daily close above 1.4120, confirming that buyers are breaking out of the recent structure.
Alternatively, enter on a controlled pullback into 1.3990–1.4030 if price stabilizes there and turns back higher.
If price loses that support zone and closes decisively below 1.3970, stand aside and wait for either deeper support to form or a cleaner breakout later.
Stop Loss
For breakout entries: stop on a daily close back below 1.4090. That would invalidate the breakout by showing price could not stay above the former ceiling.
For pullback entries: stop on a daily close below 1.3970. That would invalidate the support-hold idea and show buyers are no longer defending the zone.
Take Profit
Target 1.4190–1.4240, because that is the next clear upside area on the chart and the most natural place for price to retest if the current recovery continues.
Bottom Line
The bullish case improves only if USD/CAD holds 1.3990–1.4030 and closes above 1.4120. That would break the recent lower-high structure and open a move toward 1.4190–1.4240.
A decisive daily close below 1.3970 would invalidate the setup by confirming that the current support area has failed.
This trade idea treats 1.3990-1.4030 and 1.4190-1.4240 as zones rather than single price lines, a distinction that changes how you actually trade them. Premium members can read our lesson:
📖 Beyond Support and Resistance: Supply and Demand Zones
Reading this helps you understand why these levels are ranges instead of exact prices, how to grade a zone’s quality before trusting it to hold or reject, and how that grading would apply to the 1.3990-1.4030 and 1.4190-1.4240 areas in this setup.
And if you’re not a Premium subscriber yet, consider joining.
With Babypips Premium, you get full access to School of Pipsology lessons that help you understand not just where a zone sits on the chart, but how to judge whether it is strong enough to hold before you risk a trade on it.
Trade Idea: Bearish Pullback Scenario
Setup
The bearish scenario remains favored while price stays below the 1.4095–1.4120 resistance zone. The failed rebound, lower high, and MACD line crossing below zero indicate that sellers are regaining control.
A decisive loss of 1.3990 would confirm a breakdown and expose the next support area around 1.3890–1.3920.
Entry
Consider entering short on a daily close below 1.3990, confirming that the support zone has failed.
Alternatively, if price pushes into 1.4095–1.4120 and prints a clear bearish rejection candle, enter short on the next daily close back below 1.4060.
If price instead breaks and closes decisively above 1.4120, stand aside, as that would invalidate the bearish pullback idea.
Stop Loss
For breakdown entries: stop on a daily close back above 1.4030. That would invalidate the breakdown by showing price has reclaimed the support zone.
For rejection entries near resistance: stop on a daily close above 1.4130. That would invalidate the bearish idea by confirming buyers have pushed through resistance.
Take Profit
Target 1.3890–1.3920, because that is the next major support area below the current structure and the most likely place where buyers would try to step back in.
A sustained break through that area could eventually expose the broader 1.3550–1.3595 demand zone.
Bottom Line
The bearish case remains active while USD/CAD trades below 1.4095–1.4120. A daily close below 1.3990 would confirm continuation toward 1.3890–1.3920.
A decisive close above 1.4120 would invalidate the bearish setup by breaking the recent lower high and shifting attention back toward the 1.4190–1.4240 supply zone.
This content is strictly for informational purposes only and does not constitute as investment advice. Trading any financial market involves risk. Please read our Risk Disclosure to make sure you understand the risks involved.



