





USD/CAD has been climbing for several weeks, and the latest daily candle pushed beyond a commonly watched “stretch” zone.
That suggests the pair may be moving a bit faster than usual compared to its recent price action.
But that doesn’t automatically mean a pullback is coming. In strong trends, price can stay stretched longer than expected as buyers keep the pressure on.
That’s why you may want to watch the next few candles closely.
If the pair loses steam, it could dip back into its recent range. But if buyers keep showing up, the rally may still have room to run.
Welcome to “TA Alert of the Day.” Each day after the market close, MarketMilk scans for popular technical indicator alerts. We use these alerts as the basis for a mini-lesson, breaking down what each alert means, why it matters, and how traders might interpret it. The goal is to help beginner traders not only spot these alerts but also understand the logic behind them and how they can inform trading decisions.
What MarketMilk Has Detected
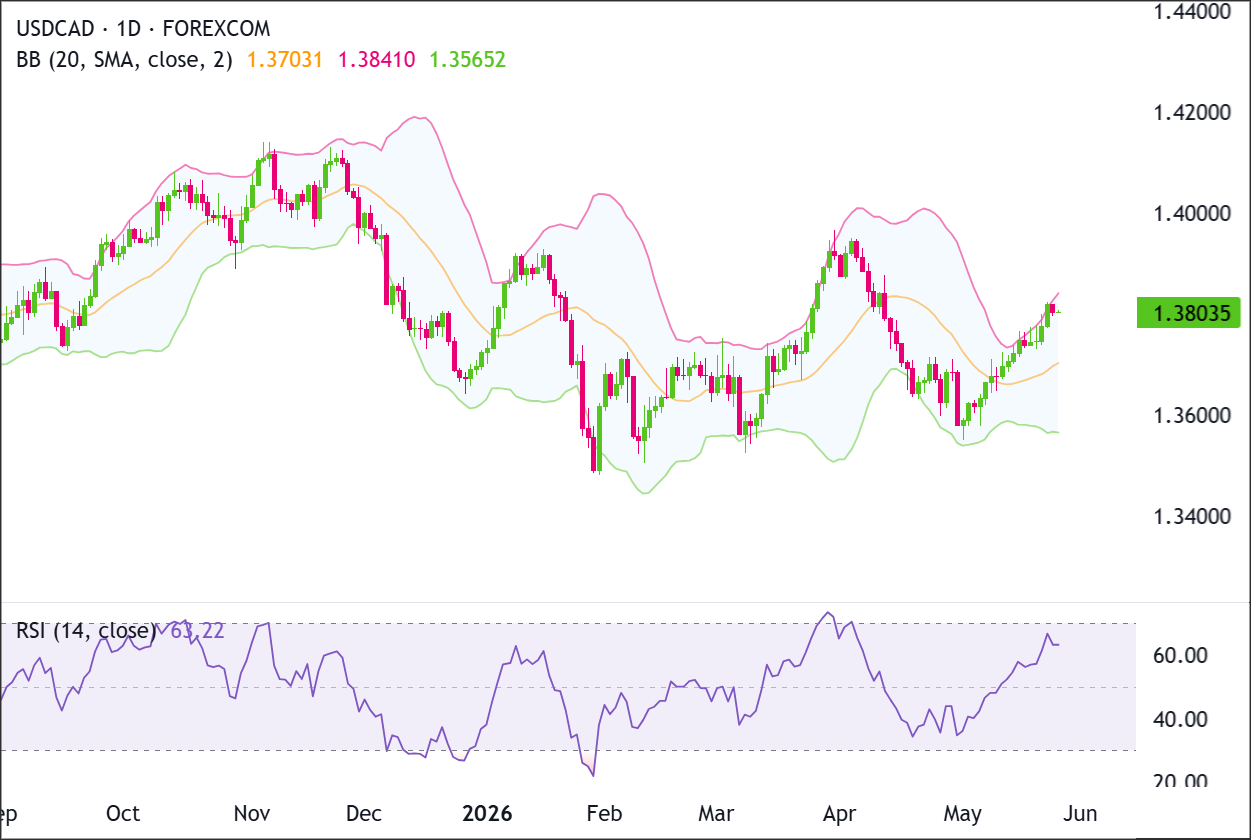
USD/CAD closed above the upper Bollinger Band (20, 2).
USD/CAD has moved above the upper Bollinger Band, suggesting buyers have pushed the pair higher at a faster-than-usual pace.
USD/CAD declined from late March highs near 1.3945–1.3967 into a mid/late-April trough around 1.3580–1.3630, then rebuilt higher through May.
The current push is occurring near a prior decision area from late March/early April (the 1.3810–1.3860 region), which can act as resistance, as supply previously showed up there.
What This Signals
Traditionally, a close above the upper Bollinger Band can attract mean-reversion interest, especially when it occurs into a known resistance zone.
This setup often marks a “stretch” in price where reversion toward the middle band (the 20-day average) becomes a scenario traders monitor, if subsequent candles fail to build on the breakout.
However, this same pattern can also represent trend strength rather than exhaustion.
In trending markets, prices can “walk the band,” where repeated closes near or above the upper band coincide with persistent demand.In that case, an initial pullback may be shallow, and sellers leaning solely on the band breach can face unfavorable follow-through if the price holds above the breakout area.
The outcome depends heavily on follow-through versus rejection in the next 1–3 daily sessions, the behavior around the 1.3810–1.3860 supply area, and whether volatility expands with directional continuation or fades back into the prior range.
Capitalize on USD/CAD Volatility Without Risking Your Own Funds.
USD/CAD price action can move quickly when U.S. and Canadian rate expectations, oil prices, or key economic data shift. When the macro backdrop changes fast, trading the volatility requires deep focus and enough capital to make your edge count.
If you have the right fundamental bias but a restrictive personal account size, Funded Trading Plus can help. They offer evaluation packages starting at just $89.00. Prove your skills with simple, fair rules, and you can double your account every 10% up to $2,500,000.
Learn more about Funded Trading Plus!
Disclosure: We may earn a commission from our partners if you sign up through our links, at no extra cost to you.
How It Works
Bollinger Bands plot a moving average (typically 20 periods) with an upper and lower band set a fixed number of standard deviations away (commonly 2).
The bands expand when volatility increases and contract when volatility falls.
A close above the upper band indicates price is moving faster than its recent statistical norm, but it does not, by itself, specify direction for what comes next.Because Bollinger Bands are based on volatility, they’re best used as a way to judge whether price may be getting stretched.
When price pushes up to the upper band, it suggests buying pressure is running hotter than usual compared to recent price action.
But if price slips back inside the bands, it can be an early clue that the upside stretch is starting to fade.
Important: Band breaches are not standalone reversal signals. In strong trends, breaches can persist and produce multiple “false mean-reversion” entries. Reliability generally improves when the breach coincides with a well-defined resistance level and is followed by clear rejection (e.g., bearish candle structure or loss of key support).
What to Look For Before Acting
Do not assume an immediate reversal lower. Consider these factors:
✅ Whether USD/CAD closes back inside the Bollinger Bands on the next daily candle (often watched as a mean-reversion confirmation)
✅ Evidence of rejection near 1.3820–1.3860 (upper wicks, bearish engulfing-style follow-through, or repeated failure to hold highs)
✅ Whether prior breakout territory around 1.3775–1.3789 (recent upper band/nearby area) flips from support to resistance on a retest
✅A drift toward the middle band (currently near 1.3688) versus continued closes pinned near the upper band
✅ Signs that volatility is expanding (larger daily ranges) or compressing (smaller ranges), since volatility affects band behavior
✅ 4-Hour structure: look for lower highs or a breakdown of a short-term rising channel (higher timeframe than the current daily view)
✅ Key nearby support zones from the recent climb, including 1.3740–1.3750 (multiple May closes) and 1.3660–1.3680 (early-May base area)
✅ Event risk: upcoming BoC/Fed communication, inflation, or labor data that could override technical mean-reversion tendencies
Risk Considerations
⚠️ Upper-band breaches can persist in trends, creating repeated whipsaws for early mean-reversion attempts
⚠️ The 1.3810–1.3860 area can act as a magnet and a trap zone, where price oscillates and stops get triggered on both sides
⚠️ Volatility can expand suddenly; wider ranges can invalidate tight risk controls even if direction is ultimately correct
⚠️ Macro headlines (rates, oil sensitivity, risk sentiment) can dominate band-based signals in USD/CAD
Potential Next Steps
Add USD/CAD to a watchlist and monitor whether price re-enters the bands or continues to “ride” the upper band over the next few sessions.
Buyers need a daily close above 1.3850 to confirm continuation, while sellers need price to lose 1.3700 to weaken the recovery structure.
If you trade mean reversion, waiting for a daily close back inside the band and a loss of nearby support can help avoid fading a strong push too early.
If you trade momentum, look for controlled pullbacks that hold above the recent breakout zone as a way to gauge whether the move is sustaining.
No matter which way you trade it, make sure your position size and “I’m wrong” levels match the pair’s current volatility.
Wider price swings may call for wider stops or smaller positions, so one noisy candle doesn’t knock you out too early.
Trade Idea: Bullish Continuation Scenario
Setup
The bullish setup is based on USD/CAD holding above the reclaimed support zone around 1.3700-1.3705 and breaking through immediate resistance at 1.3840-1.3850.
A daily close above that resistance would confirm that buyers are extending the recovery and opening the door for a move back toward the prior swing high zone near 1.3950-1.4000.
Entry
Consider entering long on a daily close above 1.3850, confirming that buyers are breaking out of the recent structure.
Alternatively, enter on a controlled pullback into 1.3700-1.3705 if price stabilizes there and turns back higher.
If price loses that support zone and closes decisively below 1.3700, stand aside and wait for either deeper support to form or a cleaner breakout later.
Stop Loss
For breakout entries: stop on a daily close back below 1.3800. That would invalidate the breakout by showing price could not stay above the former ceiling.
For pullback entries: stop on a daily close below 1.3700. That would invalidate the support-hold idea and show buyers are no longer defending the zone.
Take Profit
Target 1.3950-1.4000, because that is the next clear upside area on the chart and the most natural place for price to retest if the current recovery continues.
Bottom Line
The bullish case improves if USDCAD closes above 1.3850 and holds that breakout.
That would show buyers have absorbed the near-term resistance around the upper Bollinger Band and could support continuation toward 1.3950-1.4000.
The key invalidation level is 1.3700. A daily close below 1.3700 would weaken the bullish continuation setup and suggest the recent recovery is losing structure.
Trade Idea: Bearish Pullback Scenario
Setup
The bearish setup is based on USDCAD failing at the immediate resistance zone around 1.3840-1.3850 and then breaking back below support near 1.3700-1.3705.
A rejection from the upper band area followed by a close below 1.3700 would suggest the recovery is stalling and that sellers are regaining control.
Entry
Consider entering short on a daily close below 1.3700, confirming that the support zone has failed.
Alternatively, if price pushes into 1.3840-1.3850 and prints a clear bearish rejection candle, enter short on the next daily close back below 1.3800.
If price instead breaks and closes decisively above 1.3850, stand aside, as that would invalidate the bearish pullback idea.
Stop Loss
For breakdown entries: stop on a daily close back above 1.3705. That would invalidate the breakdown by showing price has reclaimed the support zone.
For rejection entries near resistance: stop on a daily close above 1.3850. That would invalidate the bearish idea by confirming buyers have pushed through resistance.
Take Profit
Target 1.3560-1.3580, because that is the next major support area below the current structure and the most likely place where buyers would try to step back in.
Bottom Line
The bearish case depends on USDCAD failing near 1.3840-1.3850 and then losing 1.3700. That would turn the current advance into a failed recovery attempt and favor a pullback toward 1.3560-1.3580.
The bearish idea is invalidated if price closes decisively above 1.3850. A breakout above 1.3850 would show buyers remain in control and would reduce the odds of an immediate pullback.
This content is strictly for informational purposes only and does not constitute as investment advice. Trading any financial market involves risk. Please read our Risk Disclosure to make sure you understand the risks involved.



