


GBP/CHF has extended its recent rebound into a key near-term resistance area, putting traders on alert for either follow-through strength or a possible pullback.
After a steady grind higher from late-May lows, the pair is now testing whether bullish momentum still has room to run or whether the latest push has moved too far, too fast.
That makes the next few daily candles especially important.
If buyers continue to defend higher levels, the move may point to sustained momentum.
But if price struggles near the 1.0665 to 1.0687 zone, traders may start watching for signs of rejection, fading momentum, and a potential move back toward recent support.
Welcome to “TA Alert of the Day.” Each day after the market close, MarketMilk scans for popular technical indicator alerts. We use these alerts as the basis for a mini-lesson, breaking down what each alert means, why it matters, and how traders might interpret it. The goal is to help beginner traders not only spot these alerts but also understand the logic behind them and how they can inform trading decisions.
What MarketMilk Has Detected
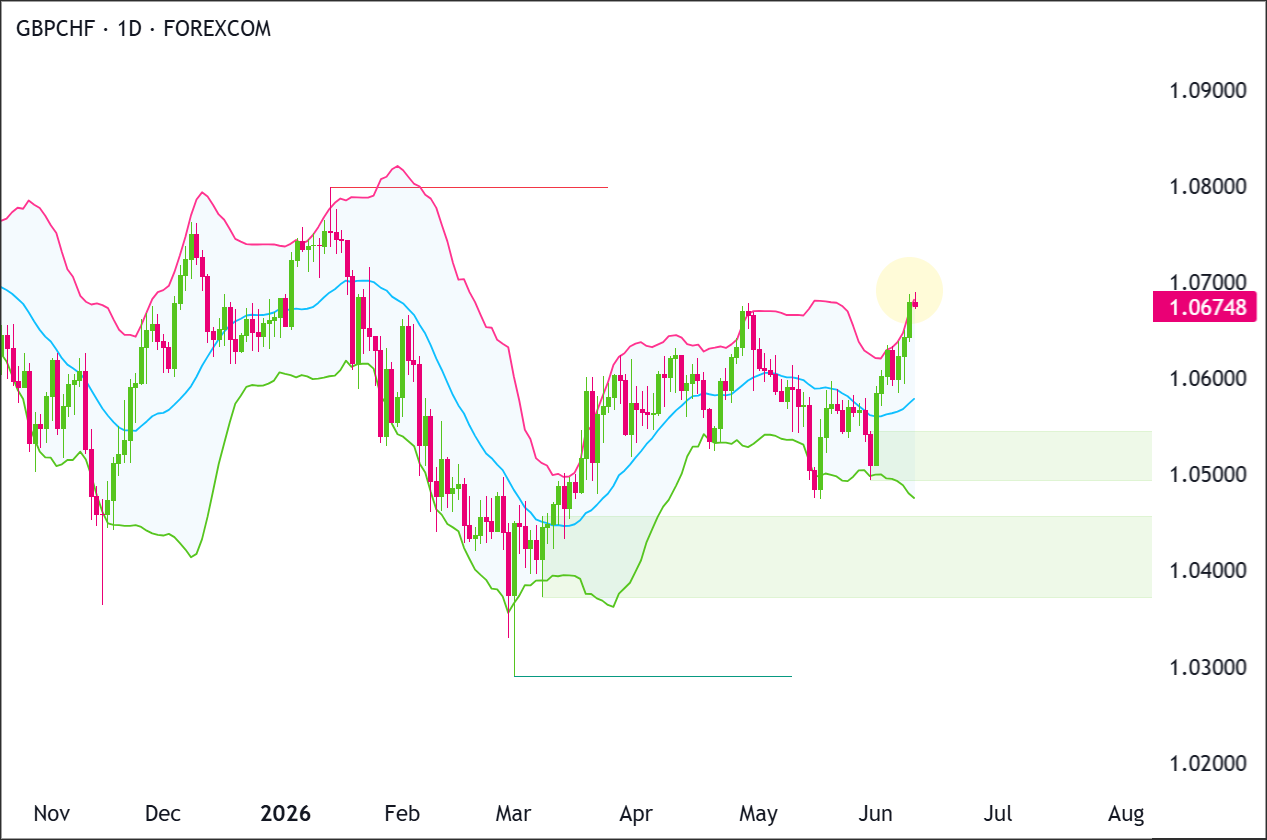
MarketMilk detected GBP/CHF closing above the upper Bollinger Band (20, 2) on the daily timeframe.
This comes after a sharp rebound from the late-May downswing that reached the 1.0500–1.0535 area, followed by a sequence of higher closes into early June.
The breach also places price back in the vicinity of prior swing activity from late April, where closes clustered around 1.0665–1.0670, making this zone a notable near-term reference point for follow-through or rejection.
What This Signals
Traditionally, a close above the upper Bollinger Band can attract mean-reversion traders because it indicates price has moved more than “normal” relative to its 20-day average.
The signal suggests that GBP/CHF may be entering a short-term overextended phase where upside can slow and pullbacks toward the middle band (the 20-day average) become more likely if the move is not sustained.
However, this same pattern can also represent trend strength. In strong directional phases, price can “walk the band,” repeatedly tagging or closing above the upper band as volatility expands.In that case, the breach sometimes coincides with continuation rather than immediate reversal, especially if subsequent candles hold above the former resistance area and dips remain shallow.
Alternatively, the breach can mark a brief volatility spike where prices push above a watched boundary and then quickly slip back inside the bands (a common failure mode).
That “pop and fade” behavior can occur where prices briefly clear a nearby resistance zone, such as the 1.0665–1.0687 region, before liquidity dries up and price reverts.
The outcome depends heavily on follow-through price action, volatility expansion vs. exhaustion, and how GBP/CHF behaves around nearby reference levels such as 1.0665–1.0670 (recent band/price confluence) and the 20-day middle band near 1.0573.
How It Works
Bollinger Bands plot a 20-period moving average (middle band) with an upper and lower band set a chosen number of standard deviations away (commonly 2).
Because the bands widen and narrow with volatility, they provide a dynamic way to gauge when price is trading unusually far from its recent average.
A close above the upper band indicates price has moved into an area that is statistically less frequent relative to the last 20 sessions.
This does not determine direction by itself; it highlights volatility and extension, which is why traders often look for additional evidence (rejection candles, momentum fade, or failed continuation) before treating it as a bearish mean-reversion setup.
Important: Upper-band breaches can persist during trends, and the signal can whipsaw when volatility is expanding. Reliability typically improves when the breach occurs into a well-defined resistance zone and is followed by clear loss of momentum (for example, a close back inside the bands or a lower high).
What to Look For Before Acting
Do not assume an immediate bearish reversal. Consider these factors:
✅ Whether the next daily candle closes back inside the Bollinger Bands (often used as mean-reversion confirmation)
✅ Signs of rejection near 1.0665–1.0687 (e.g., long upper wick, bearish engulfing, or repeated failure to hold above)
✅ A break back below nearby structure such as 1.0640–1.0629 (recent closes) to show follow-through selling
✅ Whether price drifts back toward the middle band (~1.0573) or holds elevated (distinguishes reversion vs. “walking the band”)
✅ Band behavior: are the bands expanding (trend/volatility expansion) or flattening (potential exhaustion)?
✅ Compare with the prior similar extension in late April (closes around 1.0665–1.0669) and how price behaved afterward
✅ Daily swing structure: does GBP/CHF start printing lower highs after the breach?
✅ Alignment on the Weekly chart (trend direction and whether the current push is into higher-timeframe resistance)
✅ Upcoming UK/Swiss catalysts (inflation, central bank communication, risk sentiment) that could justify sustained volatility
Risk Considerations
⚠️ Trend continuation risk: price can remain above the upper band longer than expected in a persistent advance
⚠️ False reversal risk: a minor dip back inside the bands can quickly re-extend if volatility is expanding
⚠️ Level proximity risk: trading against a move near 1.0665–1.0687 can be noisy with frequent stop-runs
⚠️ Event risk: macro headlines can overwhelm band-based signals and cause gaps or outsized daily ranges
Potential Next Steps
Consider adding GBP/CHF to your watchlist as the pair tests an important resistance area that could determine its next move.
Recent price action shows buyers stepping in aggressively after the early-June pullback, pushing GBP/CHF back into the 1.0675-1.0680 resistance area.
Momentum is currently with buyers, but price still needs a clean daily close above 1.0680 to confirm continuation.
If price rejects this area and falls back below 1.0580, sellers would have a stronger case for a pullback toward 1.0490-1.0500.
Trade Idea: Bullish Continuation Scenario
Setup
The bullish setup depends on GBP/CHF holding above the near-term support area around 1.0580-1.0600 and breaking through the recent ceiling at 1.0675-1.0680.
A daily close above 1.0680 would confirm that buyers have cleared the prior swing high and opened the door for a move toward the larger resistance zone near 1.0800.
Entry
Consider entering long on a daily close above 1.0680, confirming that buyers are breaking out of the recent structure.
Alternatively, enter on a controlled pullback into 1.0580-1.0600 if price stabilizes there and turns back higher.
If price loses that support zone and closes decisively below 1.0580, stand aside and wait for either deeper support to form or a cleaner breakout later.
Stop Loss
For breakout entries: stop on a daily close back below 1.0640. That would invalidate the breakout by showing price could not stay above the former ceiling.
For pullback entries: stop on a daily close below 1.0580. That would invalidate the support-hold idea and show buyers are no longer defending the zone.
Take Profit
Target 1.0800, because that is the next clear upside area on the chart and the most natural place for price to retest if the current recovery continues.
Bottom Line
The bullish case improves on a daily close above 1.0680. That would confirm a breakout through the recent swing high and favor continuation toward 1.0800.
The key invalidation level is 1.0580. If GBP/CHF closes back below 1.0580, the breakout structure weakens and the market may need to rebuild support before another bullish attempt.
Trade Idea: Bearish Pullback Scenario
Setup
The bearish setup is based on GBP/CHF failing at the 1.0675-1.0680 resistance zone after a sharp short-term rally.
Sellers would need price to reject this area and then break back below 1.0580 to show that the recent bullish push is losing control.
Entry
Consider entering short on a daily close below 1.0580, confirming that the support zone has failed.
Alternatively, if price pushes into 1.0675-1.0680 and prints a clear bearish rejection candle, enter short on the next daily close back below 1.0640.
If price instead breaks and closes decisively above 1.0680, stand aside, as that would invalidate the bearish pullback idea.
Stop Loss
For breakdown entries: stop on a daily close back above 1.0580. That would invalidate the breakdown by showing price has reclaimed the support zone.
For rejection entries near resistance: stop on a daily close above 1.0680. That would invalidate the bearish idea by confirming buyers have pushed through resistance.
Take Profit
Target 1.0490-1.0500, because that is the next major support area below the current structure and the most likely place where buyers would try to step back in.
Bottom Line
The bearish case depends on GBP/CHF failing at 1.0675-1.0680 and then closing below 1.0580.
That would suggest the recent rally has stalled and a pullback toward 1.0490-1.0500 is underway.
The bearish idea is invalidated on a decisive daily close above 1.0680. A breakout above that level would keep buyers in control and shift focus back toward 1.0800.
This content is strictly for informational purposes only and does not constitute as investment advice. Trading any financial market involves risk. Please read our Risk Disclosure to make sure you understand the risks involved.


