


EUR/JPY’s recent pullback has pushed price back toward an important support zone, while momentum readings suggest the move may be getting stretched.
That does not automatically mean a rebound is coming, but it does make the next few daily candles more important. If buyers defend the 183.00 level, the pair could attempt to stabilize and recover part of the decline.
If support gives way, the same stretched condition could become a warning that sellers remain firmly in control.
Welcome to “TA Alert of the Day.” Each day after the market close, MarketMilk scans for popular technical indicator alerts. We use these alerts as the basis for a mini-lesson, breaking down what each alert means, why it matters, and how traders might interpret it. The goal is to help beginner traders not only spot these alerts but also understand the logic behind them and how they can inform trading decisions.
What MarketMilk Has Detected
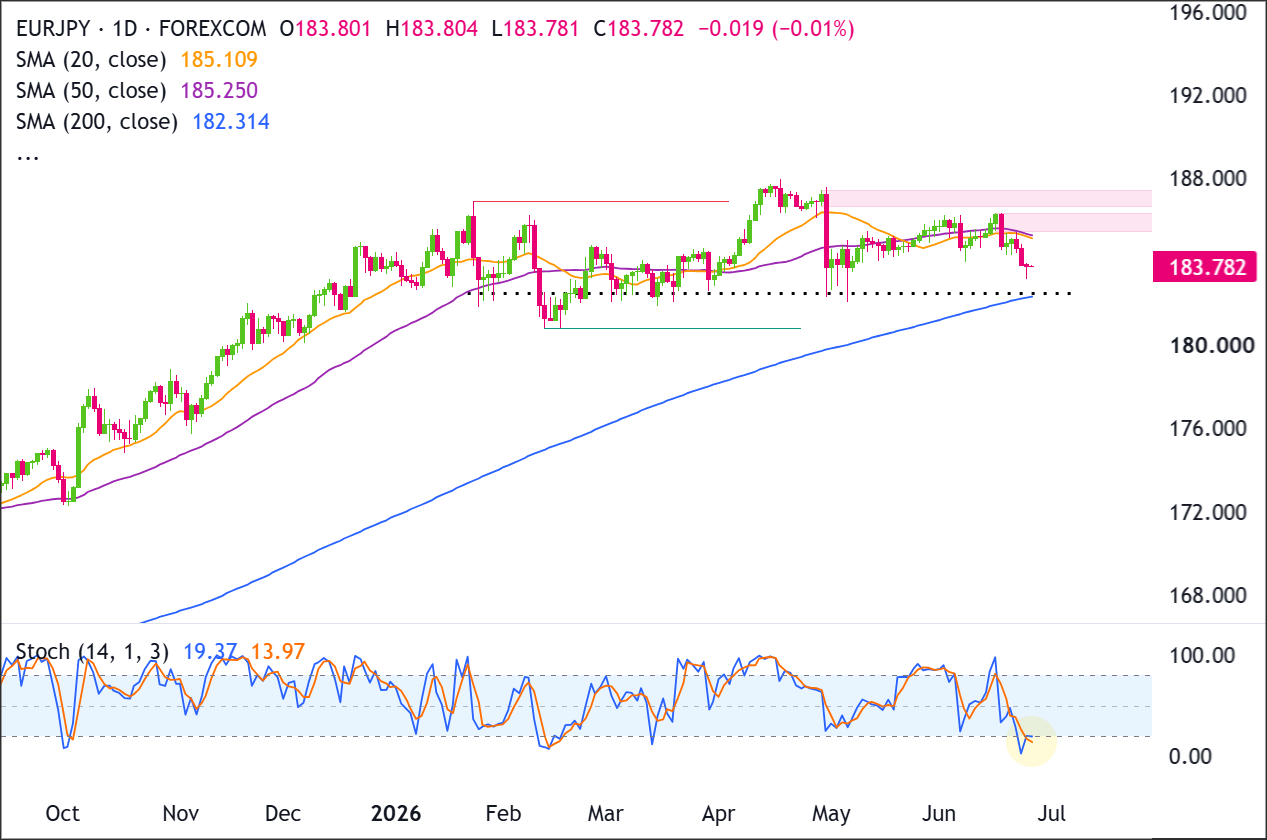
On the daily chart for EUR/JPY, the Stochastic (14,3,3 )indicator has dropped into oversold territory, with %K falling to 16.80 after crossing below the 20 threshold.
Price closed at 183.767, extending a multi-session pullback from the mid-June highs near 186.25 toward the low-183s.
Price is revisiting an area that has previously attracted buyers.
What This Signals
An oversold Stochastic reading means price has been closing near the bottom of its recent range.
That can be a clue that sellers may be getting a little stretched. It can also attract dip buyers or short covering, especially if price starts to hold near a support area.
But you should be careful. Oversold does not automatically mean “buy.”
In a strong downtrend, Stochastic can stay oversold for several sessions while price keeps falling. So jumping in too early can still lead to a quick move against the trade.
That matters here because the pullback from around 186.25 has been pretty direct. Stochastic has moved from overbought readings above 80 in early June to an oversold reading today.
This tells us price has shifted from closing near the top of its recent range to closing near the bottom of it.
The key question is what happens next.
If price holds support and Stochastic starts to turn higher, especially if it moves back above 20, that could suggest selling pressure is starting to cool. In that case, a bounce toward nearby resistance could develop.
But if Stochastic stays stuck in oversold territory and price keeps breaking lower, then the signal is more about downside trend strength than exhaustion.
How It Works
Stochastic measures where the close sits relative to the recent high-low range over a lookback period (14), then smooths it into %K and %D lines (3,3).
Readings below 20 are commonly labeled oversold momentum, meaning price has been closing near the bottom of its recent range more consistently than usual.
Because it is range-based, stochastic is most effective for spotting potential turning points in sideways-to-moderate trends and can be less reliable in strong directional markets.
Traders often wait for confirmation, such as %K turning up, a %K/%D crossover, or price reclaiming a nearby broken level before treating oversold as actionable.
What to Look For Before Acting
Do not assume a rebound is guaranteed. Consider these factors:
✅ A daily close holding above the 183.70–183.10 support area (recent swing zone and March low region)
✅ Stochastic %K turning up and reclaiming 20, or a %K/%D bullish crossover from oversold
✅ Evidence of seller exhaustion (smaller red candles, long lower wicks, or a clear base forming)
✅ A break back above near-term resistance around 184.60–185.10 (recent consolidation closes) to show demand returning
✅ Whether the pullback remains a correction versus turning into a series of lower lows and lower highs
✅ Volatility behavior: a volatility expansion after stabilization can validate that a turn has real participation
✅ Alignment on the Weekly chart (trend direction and whether price is reacting at a larger support area)
✅ Event risk: upcoming ECB/BoJ communication, inflation prints, or risk-sentiment catalysts that can move JPY pairs quickly
Risk Considerations
⚠️ Oversold can persist: stochastic can stay below 20 while price continues trending lower
⚠️ Support breaks can accelerate: a clean daily break below ~183.10 may trigger stops and extend the move
⚠️ False turns are common: early bounces can fade quickly without a structure break back above resistance
Potential Next Steps
Keep EUR/JPY on a watchlist and monitor how price behaves around 183.70–183.10.
Recent candles show sellers pressing price lower after EUR/JPY failed to hold above the short-term moving averages near 185.10-185.25.
Price is now drifting toward 182.70, while Stochastic is oversold, showing downside momentum is stretched and a reaction from support is possible if buyers step back in.
Buyers need to defend 182.50 and reclaim 186.20 to regain control, while sellers need a daily close below 182.30 to confirm a deeper breakdown.
Trade Idea: Bullish Continuation Scenario
Setup
The bullish setup depends on EUR/JPY holding 182.50, which sits inside the broader 182.30-182.75 support zone and close to the rising 200-day SMA near 182.314.
Stochastic is oversold, so a stabilization around 182.50 followed by a bullish turn would support the idea that selling pressure is becoming stretched.
If buyers defend that area and push price back through the moving-average cluster near 185.10-185.25, the next confirmation level is a daily close above 186.20. A break above 186.20 could open the door for a retest of 186.80-188.00.
Entry
Consider entering long on a daily close above 186.20, confirming that buyers are breaking out of the recent structure.
Alternatively, enter on a controlled pullback into 182.30-182.75, especially near 182.50, if price stabilizes there and turns back higher.
If price loses that support zone and closes decisively below 182.30, stand aside and wait for either deeper support to form or a cleaner breakout later.
Stop Loss
For breakout entries: stop on a daily close back below 185.25. That would invalidate the breakout by showing price could not stay above the former ceiling.
For pullback entries: stop on a daily close below 182.30. That would invalidate the support-hold idea and show buyers are no longer defending the zone around 182.50.
Take Profit
Target 186.80-188.00, because that is the next clear upside area on the chart and the most natural place for price to retest if the current recovery continues.
Bottom Line
The bullish case improves if EUR/JPY holds 182.50 and the wider 182.30-182.75 support zone, especially if Stochastic turns higher from oversold territory. A daily close above 186.20 would suggest the current pullback has been absorbed and buyers are trying to rotate price back toward 186.80-188.00.
The key invalidation level is 182.30. A daily close below 182.30 would weaken the bullish continuation setup and suggest the market may need to search for deeper support before another upside attempt.
Trade Idea: Bearish Pullback Scenario
Setup
The bearish setup is based on EUR/JPY failing below the resistance cluster around 185.10-186.20 and continuing to press toward 182.50.
Sellers gain a stronger advantage if price closes below 182.30, because that would break the current support shelf and put the 200-day SMA area under pressure.
While Stochastic is oversold, that alone is not a reversal signal unless price starts reclaiming support. Below 182.30, the next major downside area is around 180.80-181.00.
Entry
Consider entering short on a daily close below 182.30, confirming that the support zone has failed.
Alternatively, if price pushes into 185.10-186.20 and prints a clear bearish rejection candle, enter short on the next daily close back below 185.10.
If price instead breaks and closes decisively above 186.20, stand aside, as that would invalidate the bearish pullback idea.
Stop Loss
For breakdown entries: stop on a daily close back above 182.75. That would invalidate the breakdown by showing price has reclaimed the support zone around 182.50.
For rejection entries near resistance: stop on a daily close above 186.20. That would invalidate the bearish idea by confirming buyers have pushed through resistance.
Take Profit
Target 180.80-181.00, because that is the next major support area below the current structure and the most likely place where buyers would try to step back in.
Bottom Line
The bearish case remains active while EUR/JPY trades below 185.10-186.20 and struggles to reclaim the short-term moving-average cluster. A daily close below 182.30 would confirm that sellers have broken support around 182.50 and could drive price toward 180.80-181.00.
The bearish idea is invalidated if price breaks back above 186.20. A close above 186.20 would show buyers have regained control of the near-term structure and reduce the probability of a deeper pullback.
This content is strictly for informational purposes only and does not constitute as investment advice. Trading any financial market involves risk. Please read our Risk Disclosure to make sure you understand the risks involved.


