





SOL/USD just suffered a sharp selloff, pushing price below the lower end of its recent volatility range.
Moves like this can sometimes lead to a rebound, but they can also happen when downside momentum is about to increase even further.
The next few candles could offer better clues. A move back above nearby support could help a bounce take shape, while continued selling could point to further weakness.
Welcome to “TA Alert of the Day.” Each day after the market close, MarketMilk scans for popular technical indicator alerts. We use these alerts as the basis for a mini-lesson, breaking down what each alert means, why it matters, and how traders might interpret it. The goal is to help beginner traders not only spot these alerts but also understand the logic behind them and how they can inform trading decisions.
What MarketMilk Has Detected
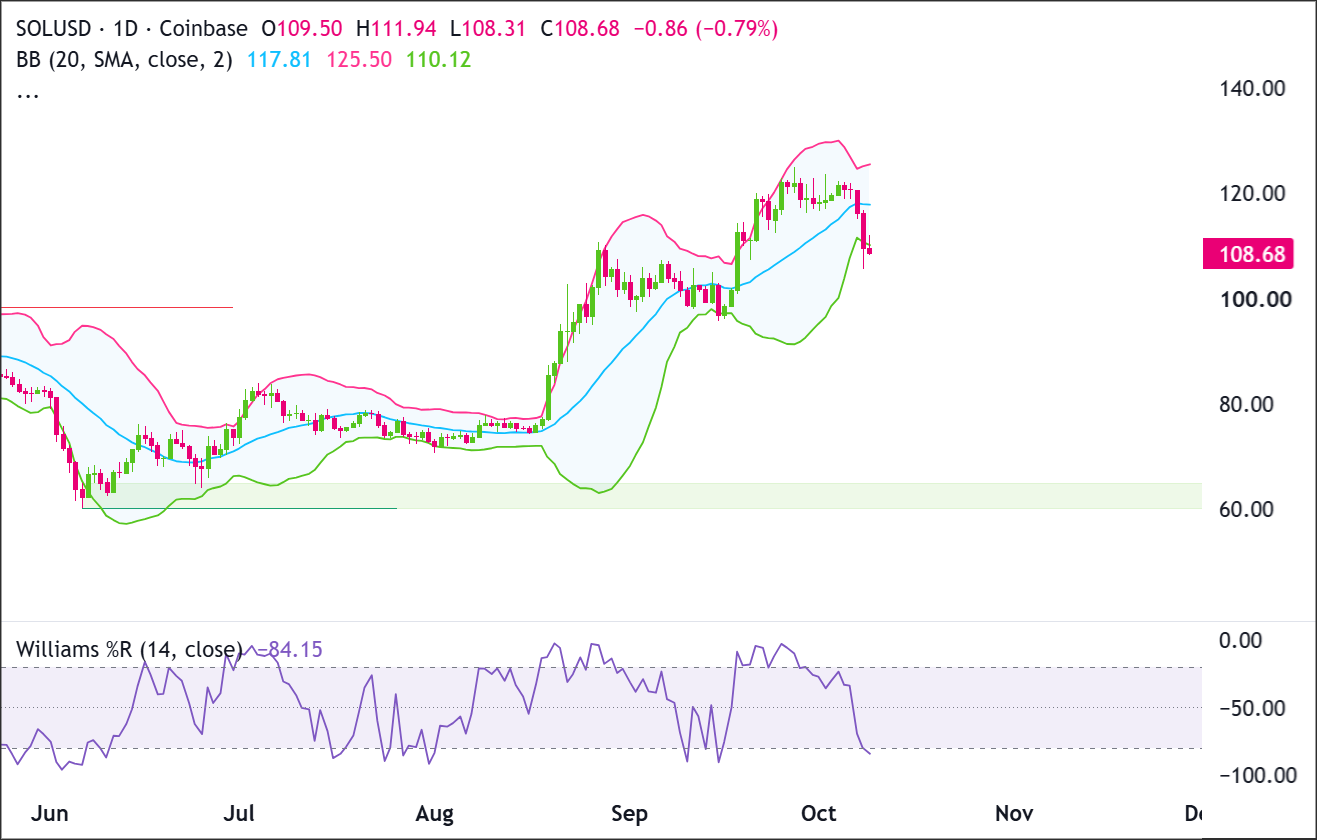
MarketMilk detected that SOL/USD fell below its lower Bollinger Band.
What This Signals
A close below the lower Bollinger Band can sometimes signal that selling has become unusually strong, which may set up a short-term rebound.
But this doesn’t automatically mean SOL/USD is ready to bounce. In a strong selloff, price can stay near or below the lower band for several sessions as sellers remain in control.
A recovery back above 110.74 would be an early sign that downside pressure is easing. A stronger move through 112–115 would add more support to the rebound case.
If SOL/USD stays below these areas and breaks 105–106, the bearish move could continue.
How It Works
Bollinger Bands measure how much price is moving around its recent average. They use a middle moving average with an upper and lower band that widen when volatility rises and narrow when volatility falls.
When price falls below the lower band, it means the move has pushed beyond its recent volatility range.This can sometimes happen before a rebound, but it can also occur when a strong decline is gaining momentum.
That’s why a lower-band breach works better as a signal to pay attention than as an automatic buy signal.
You’ll still want confirmation from price movement, support levels, and whether SOL/USD can move back inside the bands.
What to Look For Before Acting
Don’t treat the lower Bollinger Band breach as an automatic buy signal. Before acting, watch for signs that the selloff is actually starting to lose momentum.
✅ A daily close back above the lower Bollinger Band near 110.74.
✅ Support holding around 105–106 instead of breaking lower.
✅ A rebound that can move back above 112–115 and hold there.
✅ Smaller daily ranges or less aggressive selling after the recent sharp drop.
✅ A move toward the middle Bollinger Band near 117.93 without an immediate rejection.
✅ Broader crypto market conditions improving rather than showing continued risk-off pressure.
✅ Any major macro or crypto-related events that could keep volatility elevated.
Risk Considerations
⚠️ Lower-band pressure can continue: If SOL/USD keeps closing near or below the lower Bollinger Band, wait for stronger signs of stabilization before treating the move as a rebound setup.
⚠️ A rebound can fail quickly: If price bounces into 112–115 and gets rejected, treat that area as a warning that sellers may still be in control.
⚠️ Support may give way: If 105–106 breaks cleanly, reassess the bullish bounce idea and watch for signs that downside momentum is picking up again.
⚠️ Volatility can stay elevated: If daily ranges remain wide, consider using smaller position sizes or giving trades more room rather than relying on very tight stops.
⚠️ The first bounce may be misleading: If SOL/USD moves back inside the bands, look for follow-through, such as higher closes, before treating it as a meaningful recovery.
Potential Next Steps
Add SOL/USD to a watchlist for a possible rebound after its sharp pullback, while keeping a deeper decline in view.
The next daily closes would help determine whether buyers can defend the uptrend that began in August or whether sellers are starting to undo it.
Price Action Analysis
The recent large bearish candles show strong selling after the market stalled near its highs.
A lower wick around 106.00 suggests some buying interest, but buyers still need a convincing daily recovery above 110.00, followed by 118.00.
Trade Idea: Bullish Scenario
Setup
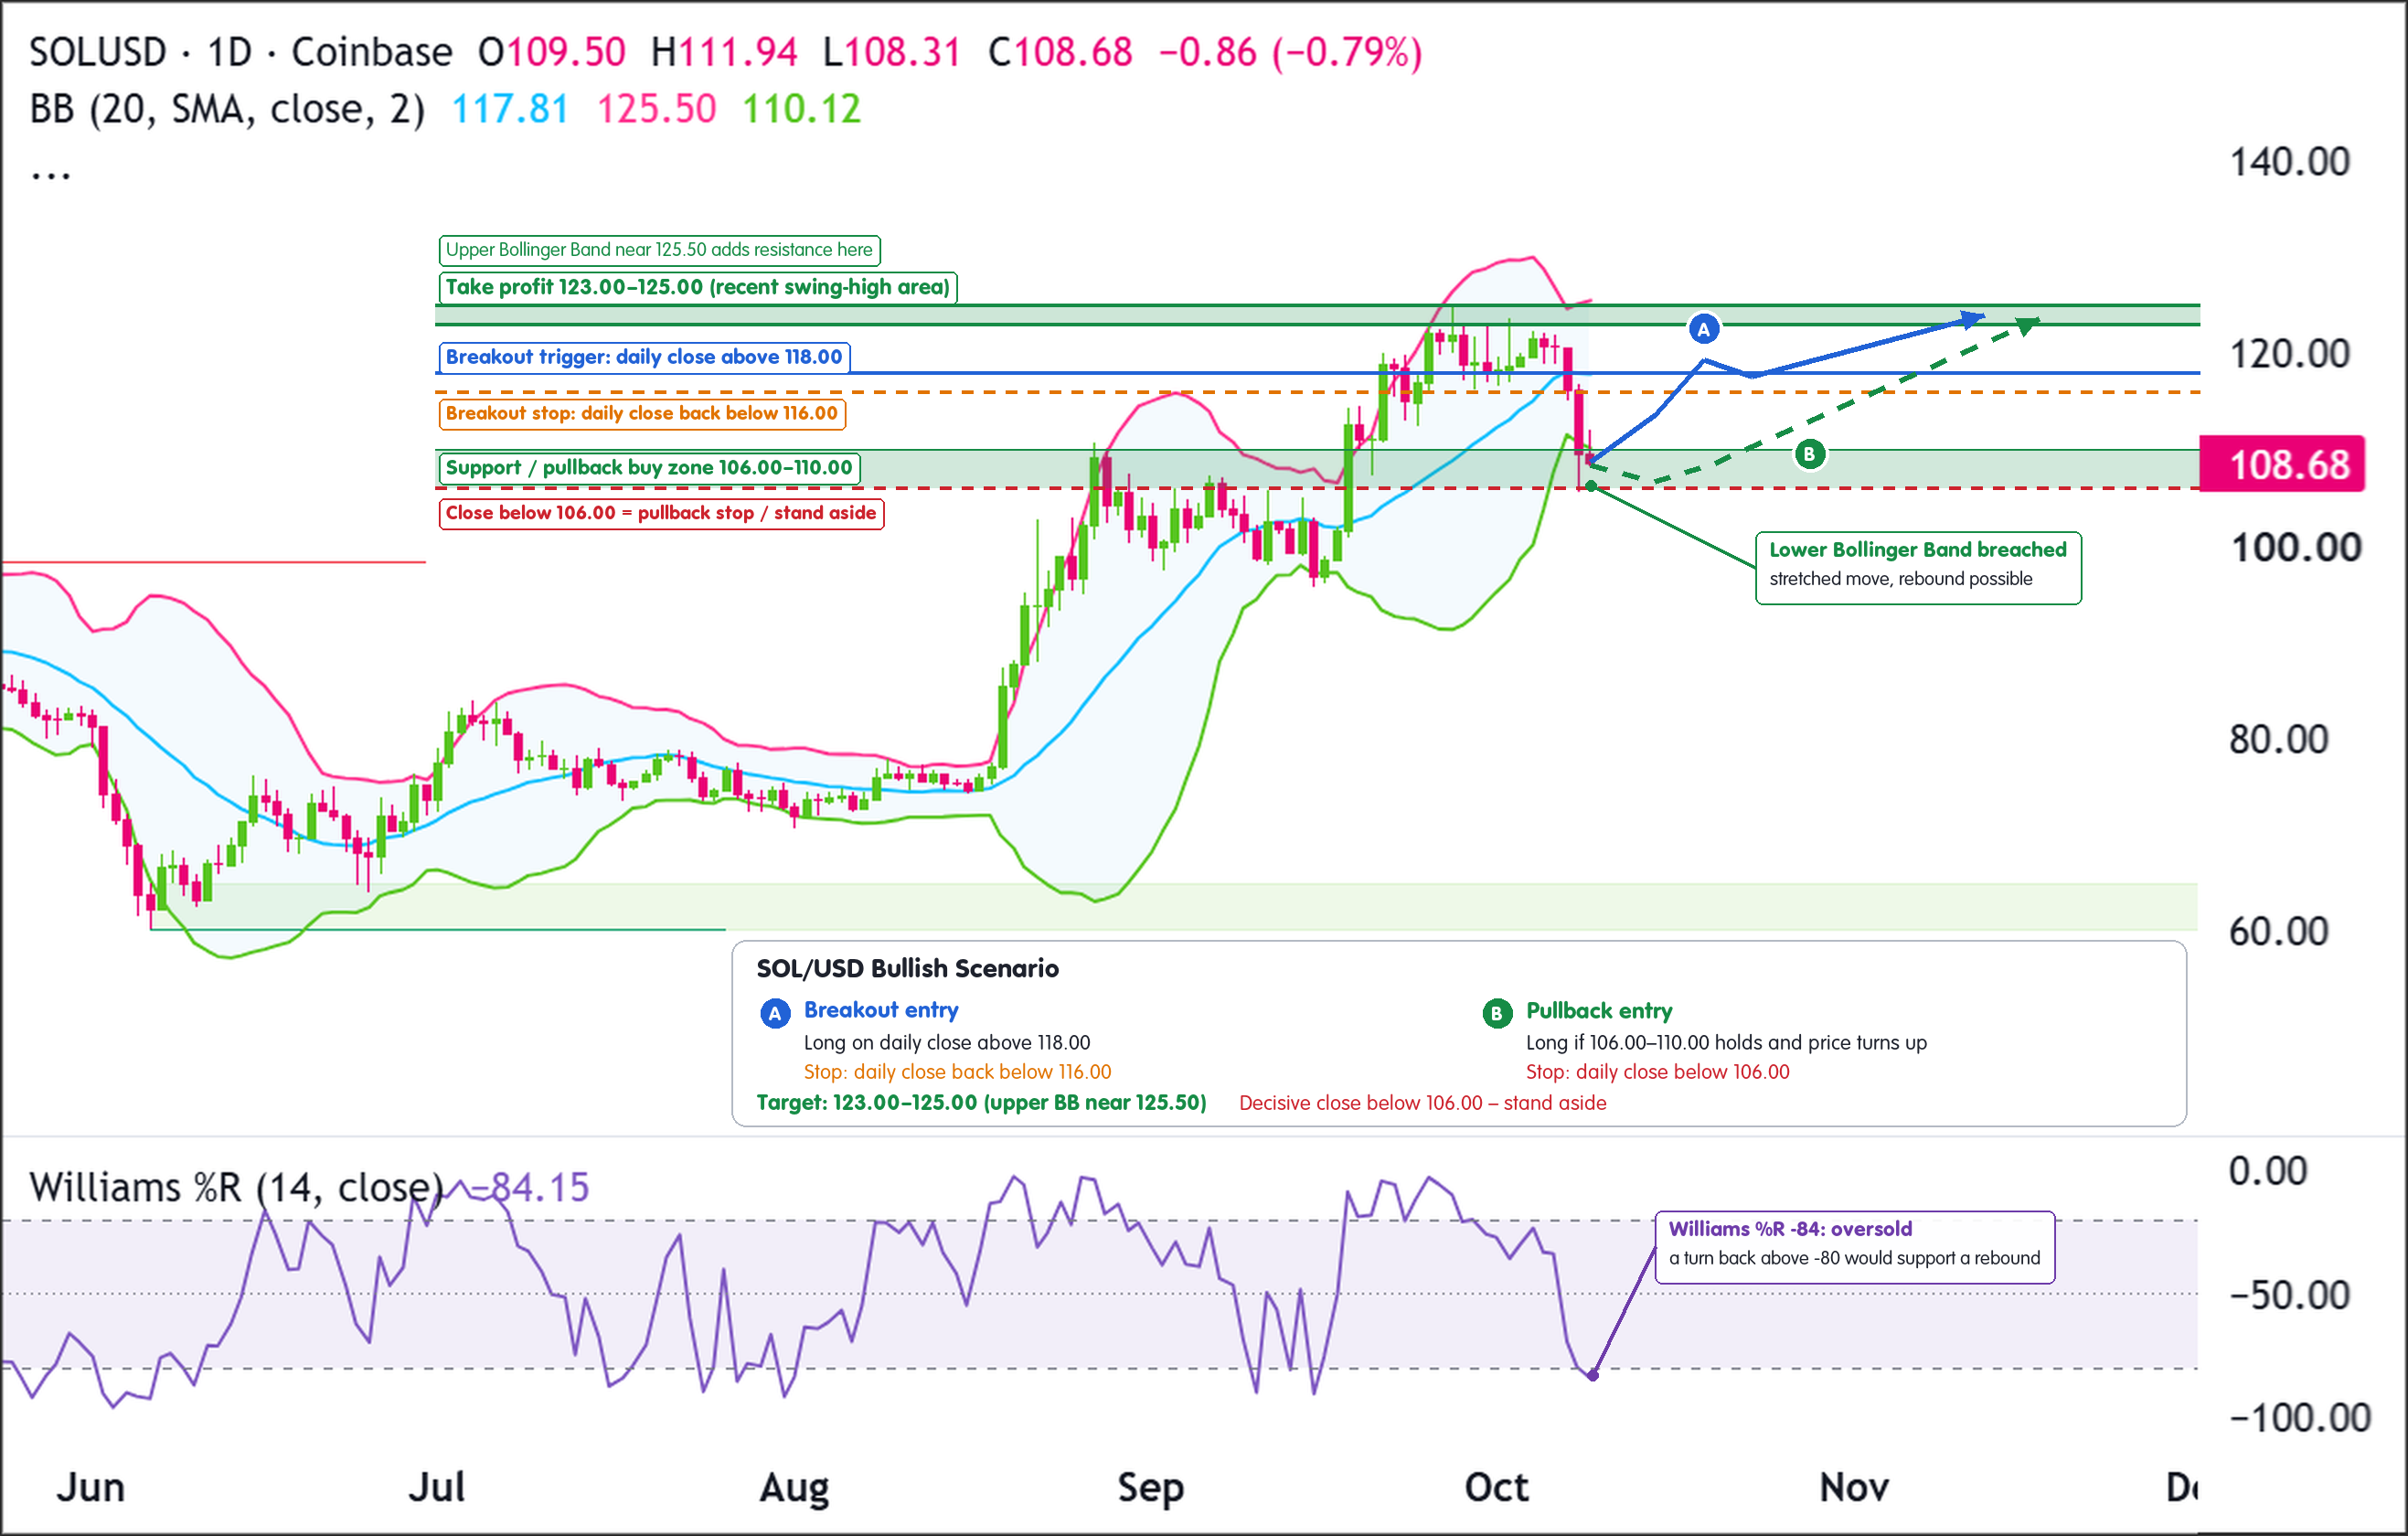
The bullish idea is that the selloff becomes another pullback within the advance that began in August.
Buyers first need to defend 106.00–110.00, then reclaim 116.00–118.00.
Entry
Consider entering long on a daily close above 118.00, confirming that buyers have reclaimed the broken support area and are rebuilding upward momentum.
Alternatively, enter on a controlled pullback into 106.00–110.00 if price stabilizes and then produces a bullish daily close back above 110.00.
If price closes decisively below 106.00, stand aside and wait for deeper support or a cleaner recovery.
Stop Loss
For breakout entries: stop on a daily close back below 116.00. This would invalidate the recovery through resistance by showing buyers could not hold the reclaimed support area.
For pullback entries: stop on a daily close below 106.00. This would invalidate the support-hold idea and show buyers are no longer defending the zone.
Take Profit
Target 123.00–125.00, where the recent swing highs sit. The upper Bollinger Band is currently near 125.50, putting it close to the same area.
Bottom Line
A daily close above 118.00 would strengthen the case for a recovery toward 123.00–125.00.
The earlier pullback opportunity depends on 106.00–110.00 holding. A daily close below 106.00 invalidates this version of the bullish setup.
Trade Idea: Bearish Scenario
Setup
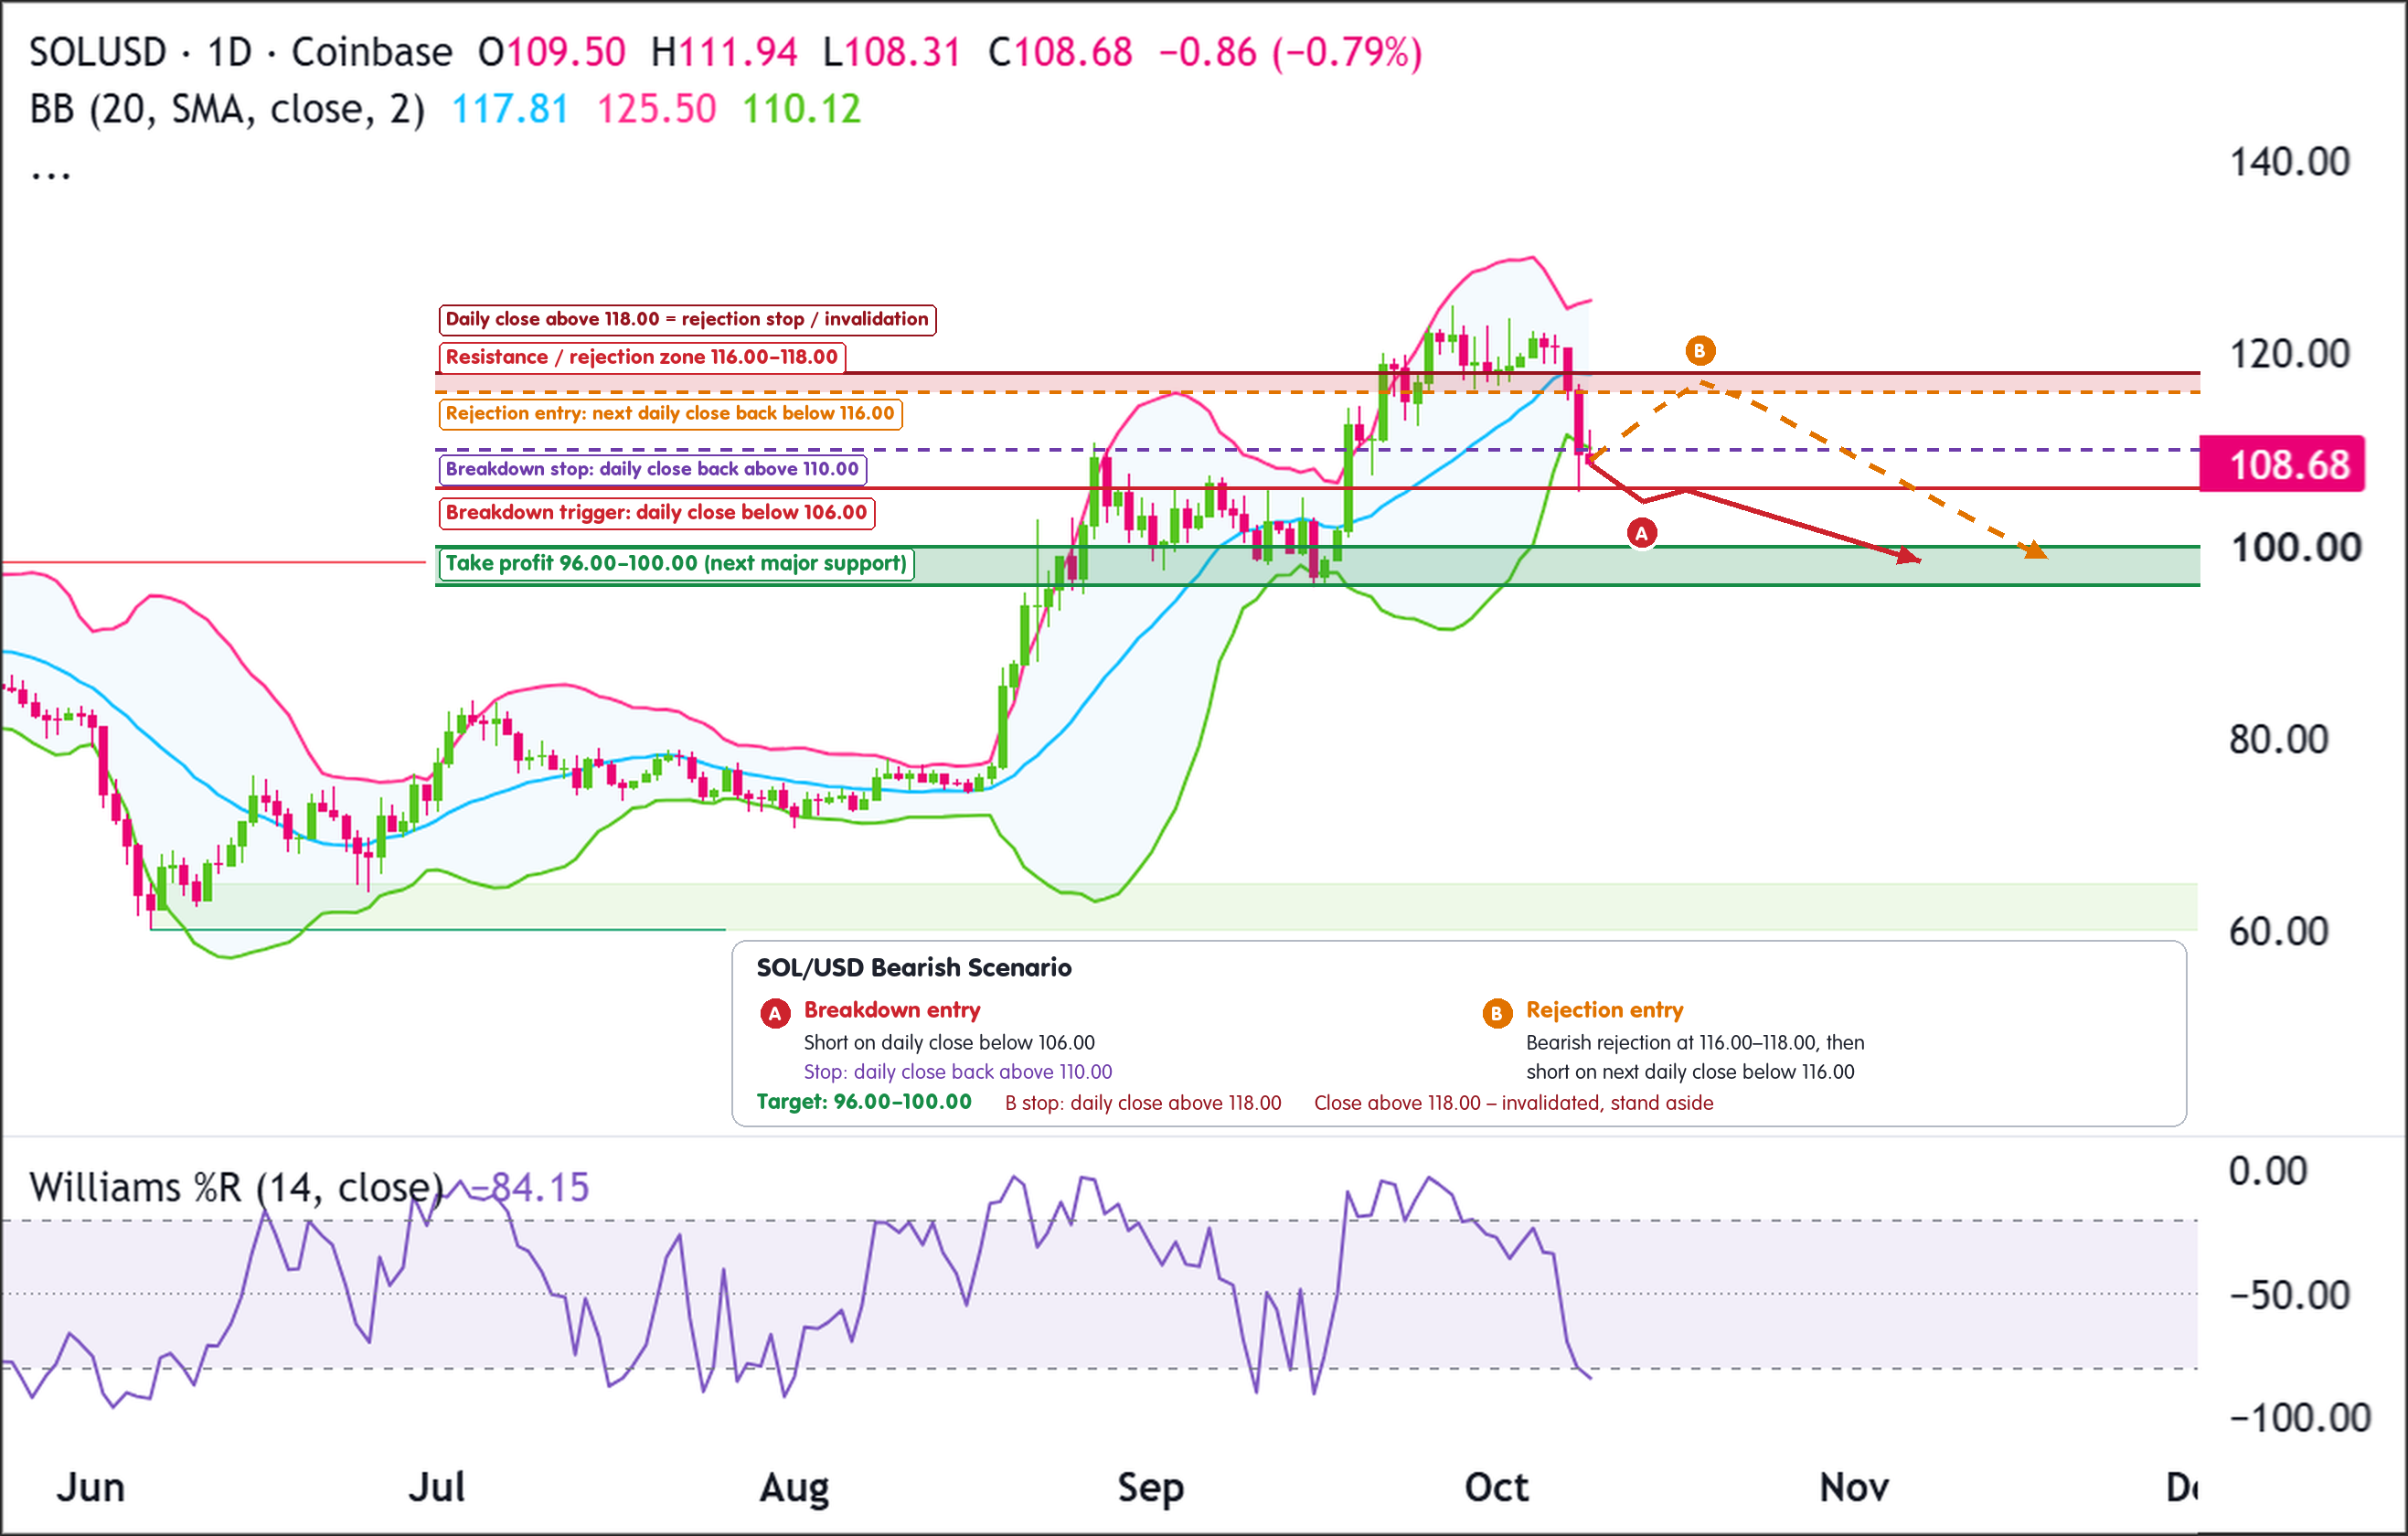
The bearish idea is that the break below 116.00–118.00 leads to a deeper pullback rather than a quick recovery.
A failed bounce into this zone, or a daily close below 106.00, would give sellers clearer control. The next major support lies at 96.00–100.00.
Entry
Consider entering short on a daily close below 106.00, confirming that the near-term support zone has failed.
Alternatively, if price rebounds into 116.00–118.00 and prints a clear bearish rejection candle, enter short on the next daily close back below 116.00.
If price instead closes decisively above 118.00, stand aside, since reclaiming the broken support area would invalidate this bearish setup.
Stop Loss
For breakdown entries: stop on a daily close back above 110.00. This would invalidate the breakdown by showing price has recovered the near-term support area.
For rejection entries near resistance: stop on a daily close above 118.00. This would invalidate the rejection by confirming that buyers were able to push through resistance.
Take Profit
Target 96.00–100.00, looking to begin taking profit near 100.00. This September base is the next clear support below the current pullback and a natural place to watch for buyers returning.
Bottom Line
Watch for rejection at 116.00–118.00 or a daily close below 106.00. Either would support a move toward 96.00–100.00.
A daily close above 118.00 would invalidate the bearish trade by showing that buyers have pushed through resistance. If you enter short after a daily close below 106.00, exit if price closes back above 110.00.
This content is strictly for informational purposes only and does not constitute as investment advice. Trading any financial market involves risk. Please read our Risk Disclosure to make sure you understand the risks involved.



