





GBP/CHF has closed above its upper Bollinger Band, putting the latest breakout under close watch
The breach points to strengthening bullish momentum and could open the way toward the previous swing high at 1.1200.
With resistance concentrated around 1.0940–1.0950 and support within the green demand zone at 1.0810–1.0900, the next few daily candles should show whether buyers can sustain the advance or whether price is likely to retreat toward deeper demand near 1.0700.
Welcome to “TA Alert of the Day.” Each day after the market close, MarketMilk scans for popular technical indicator alerts. We use these alerts as the basis for a mini-lesson, breaking down what each alert means, why it matters, and how traders might interpret it. The goal is to help beginner traders not only spot these alerts but also understand the logic behind them and how they can inform trading decisions.
What MarketMilk Has Detected
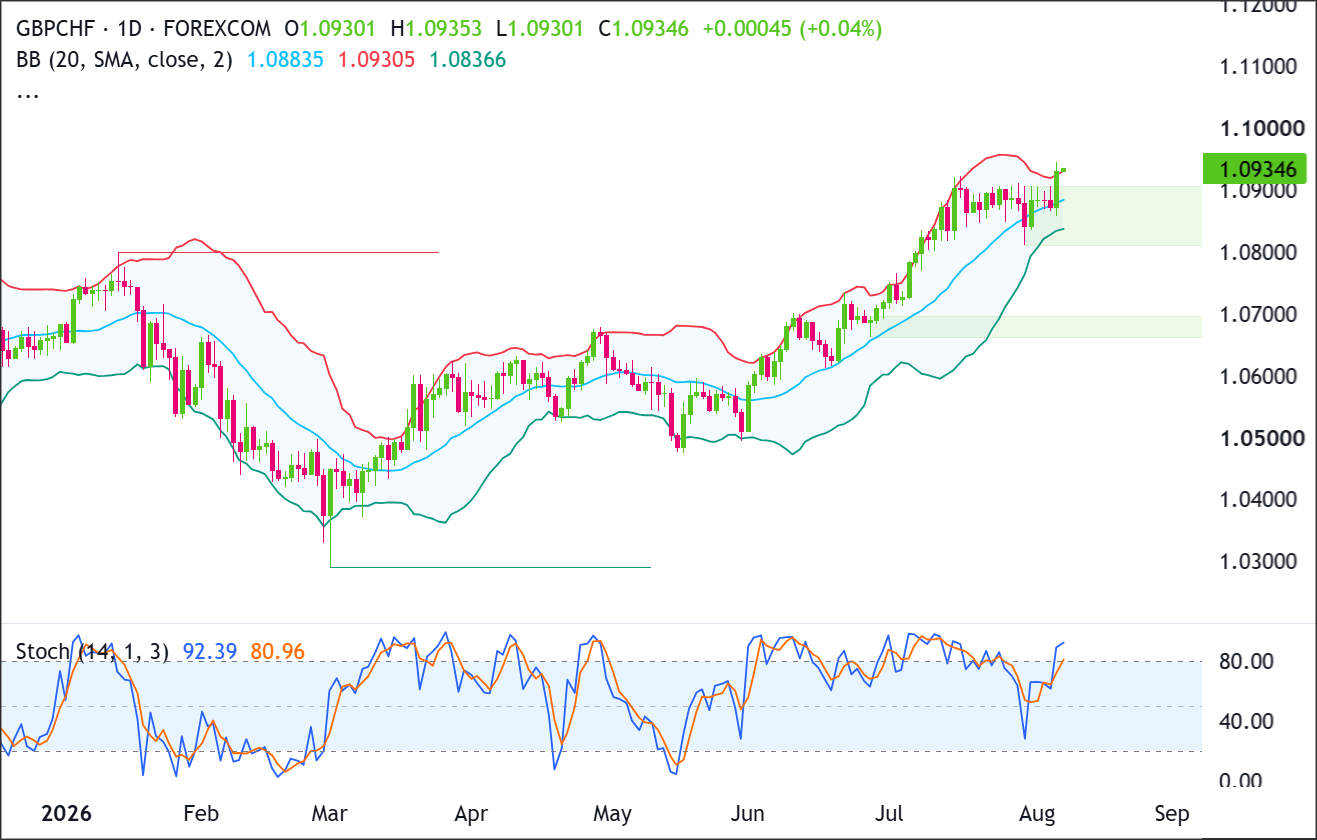
MarketMilk detected that GBP/CHF’s close crossed above the upper Bollinger Band (20, 2).
This places price outside the statistically “normal” range implied by the last 20 daily closes.
What This Signals
Traditionally, a close above the upper Bollinger Band can attract attention as a sign of overextended momentum.
In many mean-reversion frameworks, this condition often marks areas where upside can become “crowded,” and where a pullback toward the middle band (the 20-day average) becomes a common rebalancing path if the move is not sustained.
However, this same pattern can also represent trend strength, especially when a market “walks the band” during persistent advances.
In that scenario, closes outside the upper band can cluster, and what initially looks like overextension can simply be price reacting to a renewed impulse leg higher, meaning early fade attempts can be vulnerable if buyers keep defending dips.Alternatively, the signal can behave like a bull trap setup where prices briefly push above a watched volatility boundary, then slip back inside the bands on the next candle.
When that happens near a prior resistance area (such as the low-1.09s), it sometimes coincides with quick profit-taking and a sharper snap-back than traders expect from a single-day breakout.
The outcome depends heavily on follow-through vs. rejection, the slope of the 20-day basis (middle band), and whether GBP/CHF can hold above recent breakout references (low-1.09s) without immediately mean-reverting.
How It Works
Bollinger Bands plot a 20-period moving average (middle band) with an upper and lower band set a defined number of standard deviations away (commonly 2).
They measure volatility and dispersion: when bands widen, volatility is rising; when bands narrow, volatility is compressing.
A close outside the bands signals an unusually strong move relative to recent variability.
Because the bands are statistical boundaries rather than hard support/resistance, a breach does not automatically imply reversal.
Instead, traders often use the signal to judge whether price is likely to mean-revert back toward the average, or whether conditions support a momentum continuation where price can remain elevated.
Important: Bollinger Band breaches do not provide direction on their own beyond “unusual magnitude.” Reliability tends to improve when combined with structure (prior swing levels), trend assessment (rising/falling middle band), and confirmation from subsequent candles (e.g., rejection wicks vs. strong closes).
What to Look For Before Acting
Don’t assume an immediate reversal. Consider these factors:
✅ Whether the next 1–3 daily candles close back inside the bands (often strengthens mean-reversion read)
✅ Evidence of rejection near 1.0945 (e.g., long upper wicks, failed retests intraday)
✅ Whether former resistance in the 1.0920–1.0930 area acts as support on a pullback
✅ A move back toward (and reaction at) the middle band (~1.0880) versus an immediate bounce (trend-strength clue)
✅ The integrity of nearby supports around 1.0870–1.0885 and ~1.0840 (breaks can change the character of the move)
✅ Band behavior: expanding bands can favor continuation; a quick re-entry with flattening bands can favor range/mean reversion
✅ Alignment with the Weekly structure (trend direction and proximity to multi-week highs/lows)
✅ Event risk that can drive GBP/CHF volatility (e.g., UK data/BoE expectations, SNB messaging, risk sentiment shifts)
Risk Considerations
⚠️ Upper-band breaks can persist in strong trends (“band-walk” risk for bearish fades).
⚠️ A single daily close outside the band can be a one-off volatility spike, not a durable turning point.
⚠️ Mean reversion entries can face poor reward-to-risk if price does not quickly move back toward the middle band.
⚠️ GBP/CHF can gap or jump around macro headlines, making stop placement and sizing especially important.
Potential Next Steps
Add GBP/CHF to a watchlist as price attempts to extend its breakout above the recent consolidation and the upper Bollinger Band.
GBP/CHF remains in a rising structure, with price trading above the Bollinger Band basis at 1.08835 and closing at 1.09346, slightly above the upper Bollinger Band at 1.09305.
The upper-band breach supports bullish momentum and potential volatility expansion, although it also leaves price stretched in the short term.
Price consolidated beneath 1.0930 before pushing through the recent highs and closing near the top of the latest daily candle.
Buyers now need to hold above 1.0900 and extend through 1.0940–1.0950 to confirm continuation toward 1.1200.
A rejection back below 1.0900 would suggest the breakout is losing strength and could bring the green demand zones at 1.0810–1.0900 and 1.0665–1.0700 back into focus.
Trade Idea: Bullish Continuation Scenario
Setup
The bullish setup depends on GBP/CHF holding the upper portion of the green demand zone at 1.0880–1.0900 and confirming the latest upper Bollinger Band breach.
A sustained break above 1.0940–1.0950 would show that buyers are converting the recent consolidation ceiling into support despite the elevated Stochastic reading.
Entry
Consider entering long on a daily close above 1.0950, confirming that buyers are breaking out of the recent structure.
Alternatively, enter on a controlled pullback into 1.0880–1.0900 if price stabilizes there and turns back higher.
If price loses that support zone and closes decisively below 1.0835, stand aside and wait for either deeper support to form or a cleaner breakout later.
Stop Loss
For breakout entries: stop on a daily close back below 1.0900. That would invalidate the breakout by showing price could not stay above the former ceiling.
For pullback entries: stop on a daily close below 1.0835. That would invalidate the support-hold idea and show buyers are no longer defending the zone.
Take Profit
Target 1.1200, because that is the previous major swing high and the next clear upside area price could retest if the breakout and upper Bollinger Band expansion continue.
Bottom Line
The bullish case strengthens on a daily close above 1.0950, which would confirm that the upper Bollinger Band breach is developing into a genuine continuation move. The primary upside target would then be the previous swing high at 1.1200.
Momentum is already stretched, so holding 1.0880–1.0900 is important during any pullback. A decisive close below 1.0835 would invalidate the bullish setup and expose deeper demand.
Trade Idea: Bearish Pullback Scenario
Setup
The bearish setup would develop if the upper Bollinger Band breach fails and price is rejected from 1.0930–1.0950.
With Stochastic in overbought territory, the market is vulnerable to profit-taking, but sellers still need price to lose 1.0880 before a meaningful pullback is confirmed. A sustained breakdown could then carry price toward the deeper green demand zone around 1.0665–1.0700.
Entry
Consider entering short on a daily close below 1.0880, confirming that the support zone has failed.
Alternatively, if price pushes into 1.0930–1.0950 and prints a clear bearish rejection candle, enter short on the next daily close back below 1.0900.
If price instead breaks and closes decisively above 1.0950, stand aside, as that would invalidate the bearish pullback idea.
Stop Loss
For breakdown entries: stop on a daily close back above 1.0900. That would invalidate the breakdown by showing price has reclaimed the support zone.
For rejection entries near resistance: stop on a daily close above 1.0950. That would invalidate the bearish idea by confirming buyers have pushed through resistance.
Take Profit
Target 1.0700, because that level sits within the deeper green demand zone at 1.0665–1.0700 and represents the next major area where buyers may attempt to defend the broader structure.
Bottom Line
The bearish case requires a failed breakout from 1.0930–1.0950, followed by a daily close below 1.0880. That would indicate the upper Bollinger Band breach was unsustainable and increase the probability of a deeper pullback.
The primary downside target would be 1.0700, where the lower green demand zone may attract buyers. A decisive close above 1.0950 would invalidate the bearish pullback scenario.
This content is strictly for informational purposes only and does not constitute as investment advice. Trading any financial market involves risk. Please read our Risk Disclosure to make sure you understand the risks involved.



