





NZD/USD remains under pressure as the pair approaches a key technical area that could shape the next short-term move.
While downside momentum has been firm, Williams %R signals suggest traders may want to watch closely for signs of exhaustion, stabilization, or a possible shift in direction.
Welcome to “TA Alert of the Day.” Each day after the market close, MarketMilk scans for popular technical indicator alerts. We use these alerts as the basis for a mini-lesson, breaking down what each alert means, why it matters, and how traders might interpret it. The goal is to help beginner traders not only spot these alerts but also understand the logic behind them and how they can inform trading decisions.
What MarketMilk Has Detected
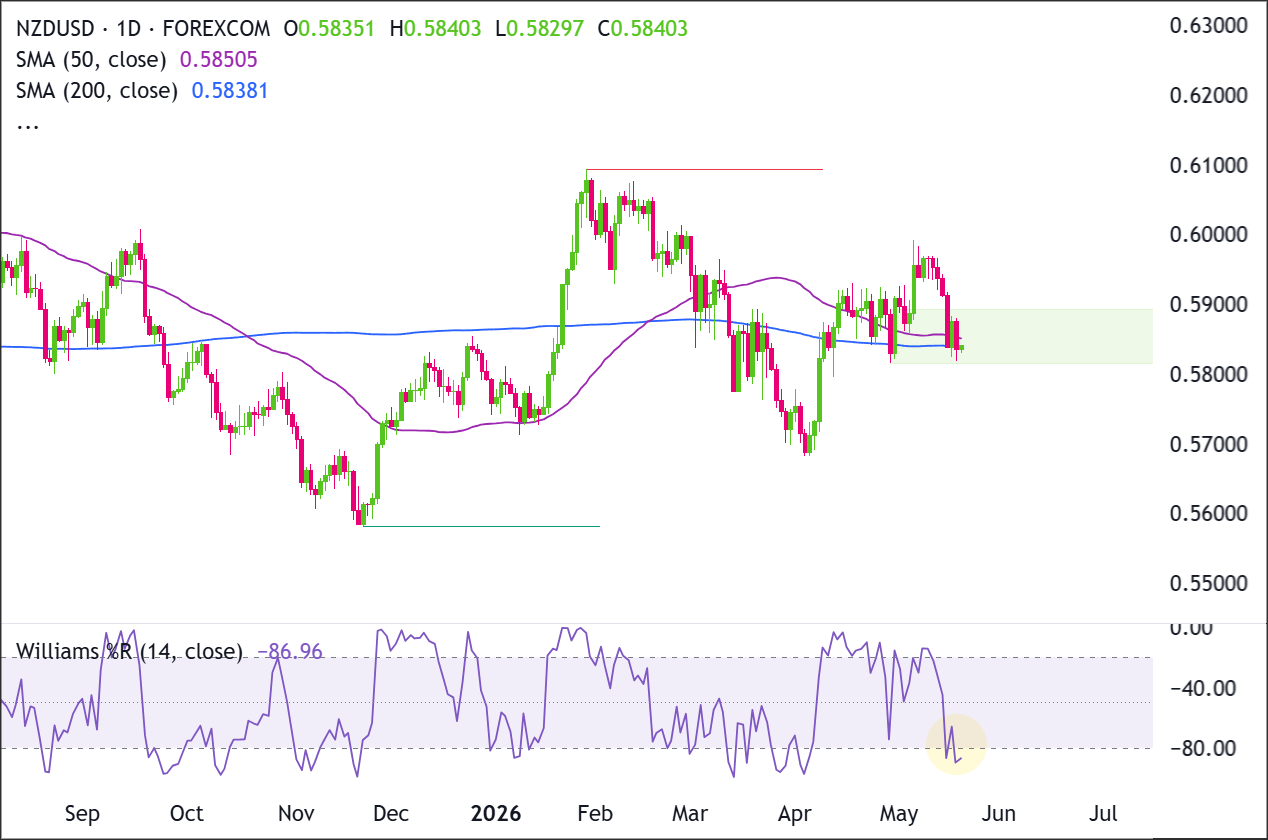
Williams %R (14) has dropped to -89.62, crossing below the -80 threshold that defines oversold momentum.
This occurred as NZD/USD fell to a low of 0.58176 and closed at 0.58356, extending the pullback from the early-May highs near 0.59910.
Recent price history shows this pair has reacted strongly after deep Williams %R readings (for example, the late-March/early-April oversold cluster before a sharp rebound into 0.59+).
In the nearer term, the market is again probing a support band around 0.582–0.584, with the next downside reference closer to 0.577–0.575.
What This Signals
Traditionally, an oversold Williams %R reading suggests that downside momentum has become stretched, which can attract dip-buying interest or short-covering, especially if price is testing a known support zone.
If the move is sustained, traders often look for momentum to improve first (Williams %R lifting back above -80) and then for price to reclaim nearby resistance areas.However, this same pattern can also represent trend persistence rather than exhaustion. In strong downswings, Williams %R can remain oversold for multiple sessions while price continues to grind lower, and early “oversold buys” can get caught in continued weakness.
This is particularly relevant here because the latest slide follows a failed attempt to hold the 0.595–0.596 region, suggesting sellers are still active on rallies.
The outcome depends heavily on follow-through in price action, the reaction at nearby support (0.582–0.584), and whether momentum recovers quickly versus staying pinned in oversold territory.
How It Works
Williams %R is a momentum oscillator that compares the latest close to the highest high and lowest low over a lookback period (here, 14 days).
It ranges from 0 to -100, where values below -80 indicate oversold momentum and values above -20 indicate overbought momentum.It is designed to highlight when price is closing near the bottom (or top) of its recent range.
“Oversold” means price is closing near the lower end of its recent 14-day range.
Traders often use it as an early warning tool and then rely on structure (support/resistance) and subsequent candles to judge whether momentum is actually turning.
Important: Oversold readings tend to work better when they occur into established support or after a sharp, emotional sell-off. They are less reliable when the broader market is trending lower and sellers keep defending rebounds.
What to Look For Before Acting
Do not assume an immediate reversal. Consider these factors:
✅ A daily close back above 0.584–0.585 to show demand is stepping in
✅ Williams %R crossing back above -80 (momentum improvement) rather than staying pinned near -90 to -100
✅ Evidence that 0.582–0.584 is holding as support (e.g., repeated lower-wick rejections)
✅ A reclaim of the near-term pivot zone around 0.588–0.590, which has recently acted as a congestion area
✅ Whether price avoids a break into the next downside area near 0.577–0.575 (late-March reference zone)
✅ Trend context on the 4-Hour chart (e.g., higher lows forming vs. continued lower highs)
✅ Alignment with the Daily structure: is this a pullback within a broader range, or the start of a larger leg down?
✅ Any improvement in broader USD risk sentiment and rate expectations (often a driver of follow-through in NZD/USD)
Risk Considerations
⚠️ Williams %R can stay oversold for extended periods in trending markets, creating early-entry risk
⚠️ A break and hold below 0.582 can turn the current support test into a continuation move
⚠️ Oversold “bounces” can be sharp but brief, leading to whipsaw if entries rely on the oscillator alone
⚠️ Event risk (macro data/central-bank repricing) can override oscillator signals and expand daily ranges
Potential Next Steps
Recent candles show a rejection from the 0.5960–0.6000 area, followed by a controlled pullback into the 0.5820–0.5900 support zone.
Sellers have short-term momentum, but price has not yet broken down decisively because it is still holding near 0.5838–0.5840.
Buyers need to reclaim 0.5900 and then clear 0.6000 to regain control, while sellers need a daily close below 0.5820 to confirm a deeper pullback.
Trade Idea: Bullish Continuation Scenario
Setup
The bullish setup depends on NZDUSD holding the 0.5820–0.5840 support area, which includes the current price region and the 200-day SMA near 0.5838.
If buyers defend that zone and push price back above 0.5900, the recent pullback can be treated as a retest rather than a breakdown.
A stronger bullish confirmation would come from a daily close above 0.6000, which would clear the most recent swing high area and open the way toward 0.6090–0.6100.
Entry
Consider going long on a daily close above 0.6000, confirming that buyers are breaking out of the recent structure.
Alternatively, enter on a controlled pullback into 0.5820–0.5840 if price stabilizes there and turns back higher.
If price loses that support zone and closes decisively below 0.5820, stand aside and wait for either deeper support to form or a cleaner breakout later.
Stop Loss
For breakout entries: stop on a daily close back below 0.5900. That would invalidate the breakout by showing price could not stay above the former ceiling.
For pullback entries: stop on a daily close below 0.5820. That would invalidate the support-hold idea and show buyers are no longer defending the zone.
Take Profit
Target 0.6090–0.6100, because that is the next clear upside area on the chart and the most natural place for price to retest if the current recovery continues.
Bottom Line
The bullish case is valid if NZDUSD holds 0.5820–0.5840 and reclaims 0.5900.
A daily close above 0.6000 would confirm renewed upside pressure and put 0.6090–0.6100 back in play.
The key invalidation level is 0.5820. A decisive close below 0.5820 would weaken the bullish structure and suggest the pullback is turning into a deeper breakdown.
Trade Idea: Bearish Pullback Scenario
Setup
The bearish setup comes from the failed push into 0.5960–0.6000 and the current pullback back into the 0.5820–0.5900 support zone.
If NZDUSD cannot reclaim 0.5900 and instead closes below 0.5820, sellers would confirm that the support zone has failed.
That would shift focus toward the April swing-low area near 0.5680.
Entry
Consider going short on a daily close below 0.5820, confirming that the support zone has failed.
Alternatively, if price pushes into 0.5900–0.6000 and prints a clear bearish rejection candle, enter short on the next daily close back below 0.5900.
If price instead breaks and closes decisively above 0.6000, stand aside, as that would invalidate the bearish pullback idea.
Stop Loss
For breakdown entries: stop on a daily close back above 0.5900. That would invalidate the breakdown by showing price has reclaimed the support zone.
For rejection entries near resistance: stop on a daily close above 0.6000. That would invalidate the bearish idea by confirming buyers have pushed through resistance.
Take Profit
Target 0.5680, because that is the next major support area below the current structure and the most likely place where buyers would try to step back in.
Bottom Line
The bearish case strengthens if NZDUSD fails below 0.5900 and closes under 0.5820.
That would confirm the recent support zone has broken and increase the chance of a move toward 0.5680.
The bearish invalidation level is 0.6000. A decisive daily close above 0.6000 would show buyers have absorbed the pullback and would reduce the odds of a bearish continuation.
This content is strictly for informational purposes only and does not constitute as investment advice. Trading any financial market involves risk. Please read our Risk Disclosure to make sure you understand the risks involved.



