


NZD/JPY is showing early signs that downside momentum may be easing after its recent pullback into the low-91s.
The pair remains under pressure, but the latest momentum signal hints at a possible turn from oversold conditions.
Will price confirm the turn with follow-through, or will the bounce fail and the downtrend continue?
Welcome to “TA Alert of the Day.” Each day after the market close, MarketMilk scans for popular technical indicator alerts. We use these alerts as the basis for a mini-lesson, breaking down what each alert means, why it matters, and how traders might interpret it. The goal is to help beginner traders not only spot these alerts but also understand the logic behind them and how they can inform trading decisions.
What MarketMilk Has Detected
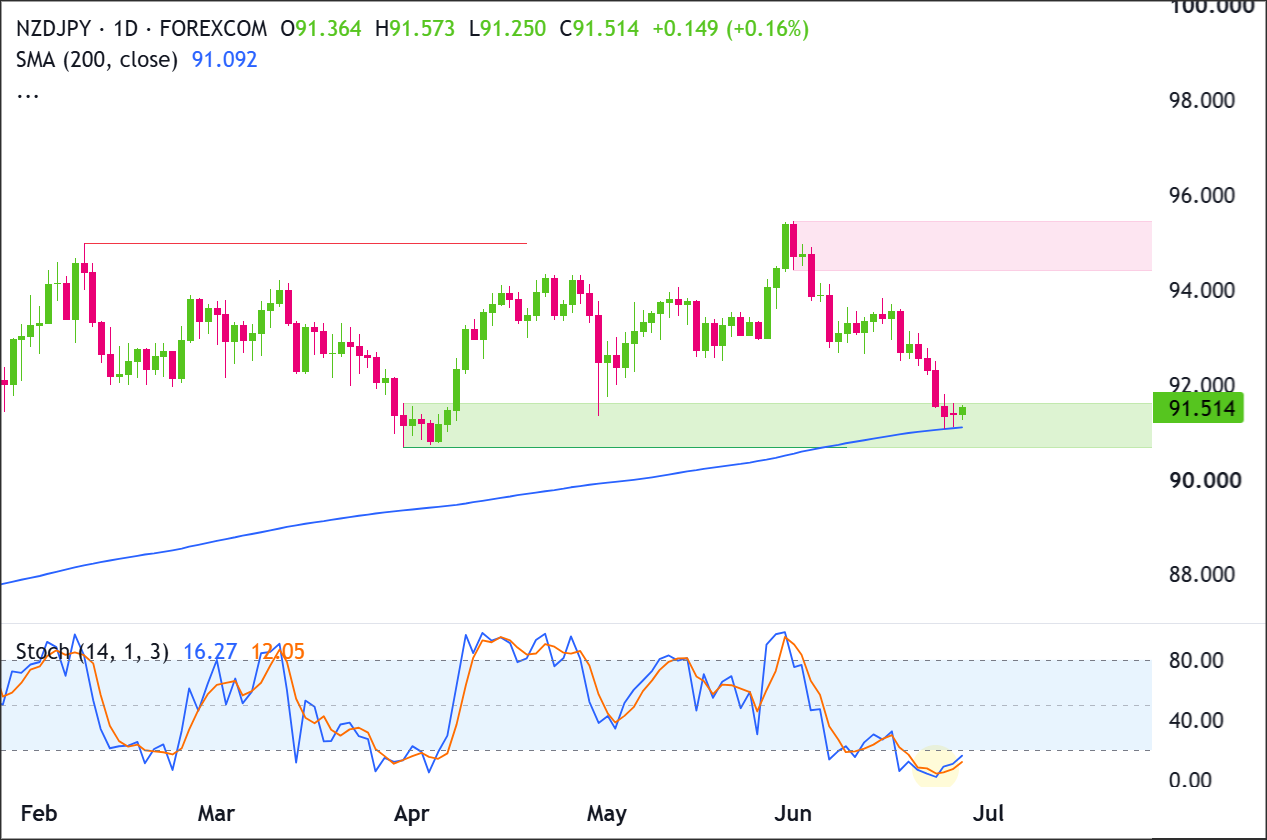
MarketMilk detected a bullish Stochastic crossover on the daily chart: the %K line moved above the %D line.
Both lines are below 20, placing the oscillator in oversold momentum territory.
This crossover is occurring after a notable pullback from the late-May/early-June highs near 95.40 down into the low-91s.
Recent candles also show the pair probing lower levels but closing back above the session low (latest low 91.098, close 91.3825), which can align with “selling pressure easing” conditions when paired with an oversold oscillator.
NZD/JPY is sitting inside the green demand zone around 91.00-91.80, with the 200-day SMA near 91.092 adding confluence at the lower edge of that support area.
The recent decline from the 94.40-95.40 pink supply zone has weakened short-term structure, but price is now testing a major support cluster. Immediate resistance sits around 92.00, followed by 93.40-93.60 and the larger supply zone at 94.40-95.40.
What This Signals
Traditionally, a Stochastic %K-over-%D crossover below 20 suggests that downside momentum may be starting to unwind.
In practice, that can attract dip-buyers and short-covering interest, especially if price begins to reclaim nearby resistance areas from the recent breakdown.
However, this same pattern can also represent a pause within an ongoing downtrend.
In persistent declines, Stochastic can stay pinned in oversold territory and produce multiple bullish crossovers that fail, where prices briefly bounce and then roll over again as the broader trend reasserts itself.Alternatively, if the crossover is the first step of a base-building phase, traders often watch for price to hold a higher low versus the recent trough area around 91.10 and then challenge prior “reaction highs.”
A sustained recovery would typically require price to start reclaiming prior support-turned-resistance zones, rather than relying on oscillator improvement alone.
The outcome depends heavily on trend context, nearby support/resistance, and follow-through in price action over the next several sessions.
Context and confirmation are essential because oscillators measure momentum shifts, NOT guaranteed turning points.
How It Works
The Stochastic Oscillator (14,3,3) compares the close to the recent 14-period high-low range to estimate where price is closing within that range.
The %K line is the faster measure, while %D is a smoothed average of %K, often used as a signal line.
A common bullish signal occurs when the faster %K line crosses above the slower %D line, suggesting that buying momentum may be starting to pick up.
Important: Stochastic signals tend to work best when they align with structure (support holding, break of a short-term downtrend line, or a reclaim of prior resistance). In strong trends, especially downtrends, bullish crossovers can be frequent and unreliable without clear confirmation from price.
What to Look For Before Acting
Do not assume the signal implies a lasting reversal. Consider these factors:
✅ Whether NZD/JPY can hold above the recent low zone near 91.10 (reduces immediate breakdown risk)
✅ A daily close back above 91.60–92.00 (nearby resistance area from the recent slide)
✅ Signs of a higher low forming on price (structure confirmation beyond the oscillator)
✅ Stochastic continuing higher and ideally pushing back above 20 (momentum recovery)
✅ Whether rallies stall near prior congestion around 92.60–93.00 (potential resistance from earlier June trading)
✅ The Daily move aligning with the Weekly structure (avoid fighting a larger downtrend)
✅ Broader risk sentiment (JPY pairs can react to “risk-off” moves even if the oscillator improves)
✅ Any major macro catalysts affecting NZD or JPY (central-bank expectations, risk events) that could override technical signals
Risk Considerations
⚠️ Oversold can stay oversold: Stochastic can remain below 20 for extended periods in strong downtrends.
⚠️ Whipsaw risk: Multiple crossovers can occur in a choppy basing phase, producing false starts.
⚠️ Resistance overhead: Nearby levels (around 91.60–92.00 and 92.60–93.00) can cap rebounds and fade the signal.
⚠️ Event-driven volatility: JPY crosses can move sharply on risk sentiment shifts, potentially invalidating oscillator-based setups quickly.
Potential Next Steps
Keep NZD/JPY on a watchlist and monitor whether price action confirms the oscillator turn.
Recent price action shows sellers pressing NZD/JPY down into the green demand zone at 91.00-91.80, but the latest candle is attempting to stabilize above the 200-day SMA near 91.092.
Stochastic is oversold, with readings near 16.27 and 12.05, which suggests downside momentum may be stretched. That does not confirm a reversal by itself, but it makes the reaction around 91.00-91.80 especially important.
Buyers need to reclaim 92.00, while sellers need a decisive close below 91.00 to confirm that demand and the 200-day SMA have failed.
Trade Idea: Bullish Continuation Scenario
Setup
The bullish setup depends on NZD/JPY holding the green demand zone at 91.00-91.80 while staying above the 200-day SMA near 91.092.
Because Stochastic is oversold, a successful defense of this zone could support a relief bounce if buyers start reclaiming nearby resistance.
A daily close above 92.00 would be the first sign that buyers are regaining short-term control, with the next upside target at 93.40-93.60.
Entry
Consider entering long on a daily close above 92.00, confirming that buyers are breaking out of the recent structure.
Alternatively, enter on a controlled pullback into 91.00-91.80 if price stabilizes there and turns back higher.
If price loses that support zone and closes decisively below 91.00, stand aside and wait for either deeper support to form or a cleaner breakout later.
Stop Loss
For breakout entries: stop on a daily close back below 91.80. That would invalidate the breakout by showing price could not stay above the former ceiling.
For pullback entries: stop on a daily close below 91.00. That would invalidate the support-hold idea and show buyers are no longer defending the zone.
Take Profit
Target 93.40-93.60, because that is the next clear upside area on the chart and the most natural place for price to retest if the current recovery continues.
Bottom Line
The bullish case depends on NZD/JPY defending the green demand zone at 91.00-91.80 and holding above the 200-day SMA near 91.092.
Stochastic being oversold supports the possibility of a rebound, but buyers still need confirmation through a daily close above 92.00.
If price closes above 92.00, the first upside target is 93.40-93.60. A daily close below 91.00 would invalidate the bullish support-hold setup and signal that the demand zone has failed.
Trade Idea: Bearish Pullback Scenario
Setup
The bearish setup depends on NZD/JPY failing to reclaim 92.00 and then losing the green demand zone at 91.00-91.80. A daily close below 91.00 would also put price below the 200-day SMA near 91.092, confirming that sellers have broken a key support cluster.
Since Stochastic is already oversold, the cleaner bearish setup would be either a confirmed breakdown below 91.00 or a failed rebound into 92.00.
Entry
Consider entering short on a daily close below 91.00, confirming that the support zone has failed.
Alternatively, if price pushes into 92.00 and prints a clear bearish rejection candle, enter short on the next daily close back below 91.80.
If price instead breaks and closes decisively above 93.60, stand aside, as that would invalidate the bearish pullback idea.
Stop Loss
For breakdown entries: stop on a daily close back above 91.80. That would invalidate the breakdown by showing price has reclaimed the support zone.
For rejection entries near resistance: stop on a daily close above 92.00. That would invalidate the bearish idea by confirming buyers have pushed through resistance.
Take Profit
Target 90.00, because that is the next major support area below the current structure and the most likely place where buyers would try to step back in.
Bottom Line
The bearish case strengthens if NZD/JPY fails below 92.00 and then closes decisively below 91.00. That would confirm a breakdown through the green demand zone and the 200-day SMA near 91.092.
The downside target is 90.00. A daily close above 93.60 would weaken the bearish view and suggest buyers have reclaimed a more important resistance area.
This content is strictly for informational purposes only and does not constitute as investment advice. Trading any financial market involves risk. Please read our Risk Disclosure to make sure you understand the risks involved.


