





Litecoin made a sharp move higher yesterday, pushing above the upper Keltner Channel.
That kind of move can be a sign that price has become stretched compared with its recent trading range.

When that happens, traders often start watching for a possible pullback as momentum cools and price moves back toward more typical levels.
But an upper Keltner Channel break is not automatically bearish. In a strong uptrend, price can stay near or above the upper band as buyers continue to push the market higher.
So the key question now is whether yesterday’s surge marked a short-term exhaustion move, or the start of another leg higher.
Let’s break down what this Keltner Channel signal means and what traders may want to watch next.
Welcome to “TA Alert of the Day.” Each day after the market close, MarketMilk scans for popular technical indicator alerts. We use these alerts as the basis for a mini-lesson, breaking down what each alert means, why it matters, and how traders might interpret it. The goal is to help beginner traders not only spot these alerts but also understand the logic behind them and how they can inform trading decisions.
What MarketMilk Has Detected
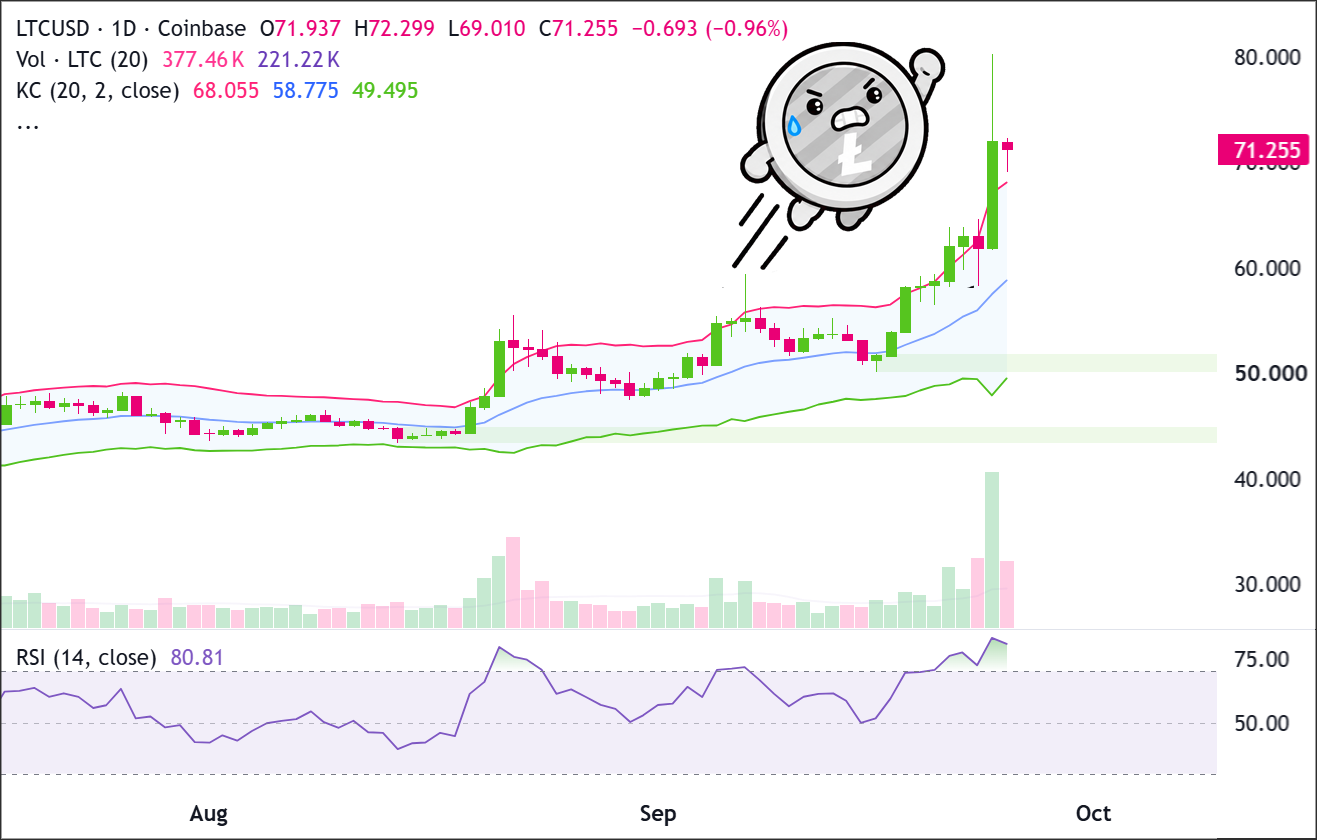
On the daily chart, LTC/USD closed above the upper Keltner Channel, triggering the alert.
What This Signals
A close above the upper Keltner Channel can mean that price has moved unusually far above its recent average.
In other words, LTC/USD may be stretched in the short term, which can sometimes lead to profit-taking and a pullback toward the middle of the channel.
But this doesn’t automatically mean price is about to fall.
During a strong uptrend, price can stay near or above the upper Keltner Channel for some time.Traders sometimes call this “walking the band.” When this happens, a break above the upper band can actually be a sign of strong buying momentum rather than an upcoming reversal.
That’s why the next few daily candles are important. If LTC/USD falls back inside the channel, it could suggest that yesterday’s move was overextended.
If price stays above the upper band or holds its recent breakout area, it could be a sign that buyers are still in control.
So instead of treating this as an automatic sell signal, you may want to watch what price does next and look for confirmation.
How It Works
Keltner Channels help traders see when price has moved farther than usual from its recent average.
The indicator has a middle line, usually based on an exponential moving average (EMA), with an upper and lower band around it.
Those bands adjust based on the market’s recent volatility using the Average True Range (ATR). When volatility picks up, the channel gets wider. When volatility drops, it gets narrower.
With the (20, 10, 2) settings used here, the Keltner Channel uses a 20-period average for its middle line and a 10-period ATR to help set the upper and lower bands.
If price moves above the upper band, it means price has moved unusually far compared with its recent trading range.
But that doesn’t mean traders should automatically sell. A move above the upper band can mean price is stretched and may pull back, but it can also be a sign of strong momentum if the uptrend continues.
Important: A move above the upper band is more likely to signal that price is stretched and may pull back when it happens near resistance or after several moves higher. It is less reliable when it happens early in a new uptrend. A single large candle, like today’s, can also temporarily widen ATR-based bands and increase the chance of a false signal.v
What to Look For Before Acting
Don’t assume an immediate reversal. Consider these factors:
✅ Watch the next 1–3 daily candles. If price closes back below the upper band, it could mean the recent surge is losing momentum. If price keeps closing above the band, the strong move may continue.
✅ Watch the 62–64 area. This used to be resistance. If price pulls back, see if buyers step in around this area and turn it into support.
✅ Watch the middle Keltner line around 57.46. Price may eventually pull back toward this level. The important question is whether price holds there and bounces, or falls through it.
✅ Look for signs that sellers are taking control. For example, lower highs, a large red candle, or a daily candle that closes sharply lower could signal that the rally is weakening.
✅ Watch for signs that buyers are running out of steam. Long upper wicks or repeated attempts that fail to get back above the recent high of 80.25 could be warning signs.
✅ Check the Weekly chart. Look for any major resistance above the current price. This can help you tell whether price is making a genuine breakout or simply spiking into an area where sellers may step in.
✅ Keep an eye on the broader crypto market, especially bitcoin. If bitcoin and other crypto are also rallying, this move may be part of a broader risk-on move. If the rest of the market is weak, the strength here may be more isolated.
Risk Considerations
⚠️ Price could stay above the upper Keltner band for a while. In a strong trend, price can remain stretched longer than expected, so being above the band does not automatically mean a pullback is about to happen.
⚠️ Expect the possibility of sharp swings in both directions. After such a large daily move, price can become unpredictable and quickly move up or down before choosing a clearer direction. This can also trigger stop losses on both sides.
⚠️ Resistance above the current price may be harder to identify. Because price moved so quickly beyond its recent highs, there may not be many obvious resistance levels nearby. That can lead to larger and more volatile price moves.
⚠️ A stretched price does not tell you when a pullback will happen. Price may eventually move back toward its average, but that could happen soon, much later, or not until price moves significantly higher first.
Potential Next Steps
Add LTC/USD to a watchlist and watch how price behaves after its sharp breakout.
Technical Analysis
LTC/USD has been building a clear pattern of higher lows since its mid-July swing low near 43.50.
The structure strengthened after price broke out of its range in late August, with buyers continuing to push price to higher highs and higher lows.
Yesterday’s candle made a powerful move higher and briefly reached roughly 80.00, but it left behind a large upper wick.
This shows buyers were able to push price sharply higher, but sellers became much more active near the highs.
Price trading well above the upper Keltner Channel shows strong buying momentum, but it also suggests the move has become stretched.
RSI is above 70 and in the overbought region. This supports the strong bullish momentum, but it also raises the chance of a short-term pullback or consolidation before another move higher.
Buyers need to push through 72.30 and eventually clear 80.00 to keep the trend moving toward higher levels.
Trade Idea: Bullish Continuation Scenario
Setup
The bullish setup depends on LTC/USD holding its recent breakout and continuing the pattern of higher highs and higher lows.
The first area buyers need to defend is around 67.50–68.50, which lines up closely with the upper Keltner Channel near 68.06.
If price holds this area and then closes above 72.30, it would suggest buyers are regaining control after the large upper wick.
A later break above 80.00 would be another strong sign that the uptrend is continuing and could open the door to a move toward the psychological 100.00 level.
Entry
Consider entering long on a daily close above 72.30, confirming that buyers are breaking out of the recent structure.
Alternatively, enter on a controlled pullback into 67.50–68.50 if price stabilizes there and turns back higher.
If price loses that support zone and closes decisively below 67.50, stand aside and wait for either deeper support to form or a cleaner breakout later.
Stop Loss
For breakout entries: stop on a daily close back below 68.00. This would invalidate the breakout by showing price could not stay above the former ceiling and upper Keltner area.
For pullback entries: stop on a daily close below 67.50. This would invalidate the support-hold idea and show buyers are no longer defending the zone.
If LTC/USD breaks above 80.00 and keeps making higher highs and higher lows, consider trailing the stop higher beneath newly formed swing lows rather than using a fixed exit. This would help protect gains while still giving the trend room to continue toward 100.00.
Take Profit
Use 80.00 as the first major upside area to watch, since this is where the large upper wick on the latest completed candle topped out.
If price breaks above 80.00 and continues trending higher, consider trailing the stop rather than closing the entire position.
The larger upside target would then be 100.00, which is an important psychological round-number level and a natural area for traders to watch if the uptrend continues.
Bottom Line
The bullish trend remains intact as long as LTC/USD continues holding above roughly 67.50–68.50. A daily close above 72.30 would strengthen the case for another move toward 80.00.
If price breaks above 80.00 and continues making higher highs and higher lows, consider trailing the stop to protect gains while allowing the trade to run toward 100.00. A decisive close below 67.50 would invalidate the near-term bullish setup.
Trade Idea: Bearish Pullback Scenario
Setup
The bearish setup is based on the possibility that the recent rally has become stretched. RSI is in the overbought region, price has pushed well above its upper Keltner Channel near 68.06, and the large upper wick shows strong selling pressure after LTC/USD reached roughly 80.00.
The main resistance area is 72.00–80.00. Sellers would gain stronger control if price falls back below 68.00, which would put the recent breakout under pressure and increase the chance of a larger pullback.
Entry
Consider entering short on a daily close below 68.00, confirming that the support zone has failed.
Alternatively, if price pushes into 72.00–80.00 and prints a clear bearish rejection candle, enter short on the next daily close back below 70.00.
If price instead breaks and closes decisively above 80.00, stand aside, as this would invalidate the bearish pullback idea.
Stop Loss
For breakdown entries: stop on a daily close back above 68.50. This would invalidate the breakdown by showing price has reclaimed the support zone.
For rejection entries near resistance: stop on a daily close above 80.00. This would invalidate the bearish idea by confirming buyers have pushed through resistance.
Take Profit
Target 58.75–60.00, because this area sits near the middle Keltner Channel at 58.78 and is the next clear support area below the current structure.
If selling becomes much stronger, the green demand zone around 50.00–51.50 would become the next major area where buyers may try to step back in.
Bottom Line
The bearish case becomes more interesting if LTC/USD continues struggling inside 72.00–80.00 and then closes below 68.00. This would suggest the recent breakout is losing momentum and could trigger a pullback toward 58.75–60.00.
A stronger decline could eventually bring the green demand zone at 50.00–51.50 into focus. A daily close above 80.00 would invalidate the bearish setup by confirming buyers have pushed through the recent rejection area.
This content is strictly for informational purposes only and does not constitute as investment advice. Trading any financial market involves risk. Please read our Risk Disclosure to make sure you understand the risks involved.



