





GBP/USD is trading near the top of its recent range after climbing steadily from late-July lows, putting the pair near an important resistance area.
Price is pressing into a resistance zone around 1.3660–1.3680, where buyers have struggled to sustain further gains.
With momentum showing signs of cooling near these recent highs, the next few sessions could reveal whether the pair is simply pausing before another push higher or setting up for a deeper pullback.
Welcome to “TA Alert of the Day.” Each day after the market close, MarketMilk scans for popular technical indicator alerts. We use these alerts as the basis for a mini-lesson, breaking down what each alert means, why it matters, and how traders might interpret it. The goal is to help beginner traders not only spot these alerts but also understand the logic behind them and how they can inform trading decisions.
What MarketMilk Has Detected
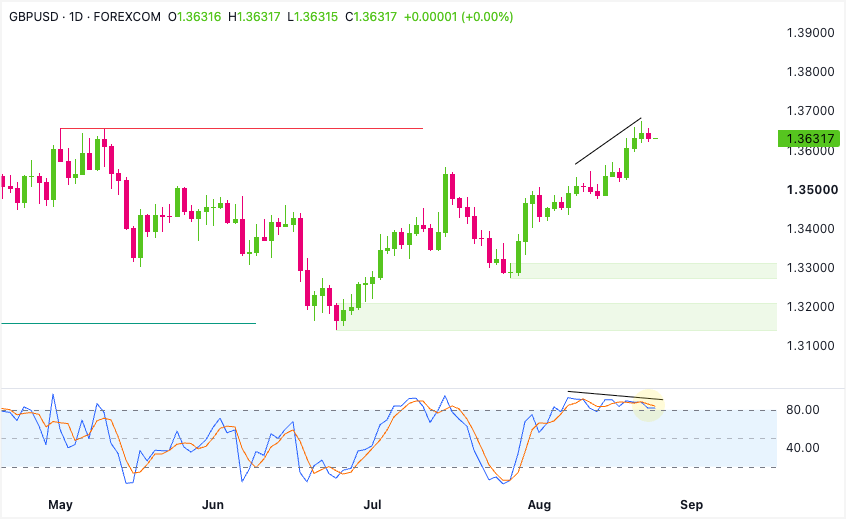
MarketMilk detected a bearish Stochastic (14,3,3) crossover on the daily chart: %K has crossed below %D.
Notably, both lines remain above 80, placing the signal in an area commonly associated with overbought momentum.
What This Signals
A %K cross below %D above 80 suggests that upside momentum is decelerating after a strong run.
When it occurs near a nearby resistance zone (here, the 1.366–1.368 region), it can attract traders looking for signs of a pullback or at least a pause, especially if price begins to post lower daily highs.
However, this same pattern can also represent a temporary reset within an ongoing uptrend.In strong directional moves, Stochastics can stay elevated for extended periods and produce multiple bearish crossovers that do not lead to sustained downside.
It sometimes coincides with brief dips that quickly recover as buyers defend prior breakout/pivot levels.
The outcome depends heavily on follow-through in price action and whether GBP/USD can hold above nearby supports while the oscillator cools.
How It Works
The Stochastic oscillator compares the latest close to the recent high-low range (here, over 14 periods).
The %K line reflects the current position within that range, while %D is a smoothed moving average of %K (with additional smoothing from the 3,3 settings).
Crossovers are commonly used to flag shifts in momentum…not direction on their own.
Readings above 80 typically indicate overbought momentum, while readings below 20 indicate oversold momentum.
Importantly, “overbought” does not mean price must fall! It often means the market has been closing near the top of its recent range, which can persist during trends.
Important: Stochastic crossovers tend to be less reliable in choppy, range-bound markets (whipsaws) and more informative when they align with clear resistance/support structure and subsequent candle confirmation (e.g., breakdowns, failed retests, or momentum continuation signals).
What to Look For Before Acting
Don’t assume an immediate reversal. Consider these factors:
✅ Whether GBP/USD fails again near 1.3659–1.3676 (e.g., long upper wicks, lower daily close)
✅ A daily close back below ~1.3606, turning the recent pivot into resistance
✅ Stochastic follow-through: %K and %D continue falling and ideally move out of the >80 zone rather than snapping back up
✅ Evidence of a lower high / lower low sequence on the daily chart
✅ Reaction around 1.3486–1.3433: does that former consolidation zone hold as support, or break and accelerate?
✅ Confirmation from a higher timeframe: check the Weekly chart for trend structure and whether momentum is topping or still expanding
✅ Volatility and range expansion: a bearish signal is more meaningful if daily ranges widen on down days
✅ Macro catalyst timing: upcoming BoE/Fed communication, UK/US inflation and labor prints can overwhelm oscillator signals
✅ USD cross-check: whether broad USD strength is appearing simultaneously (e.g., supportive price action across major USD pairs)
Risk Considerations
⚠️ Trend persistence risk: Stochastics can stay “overbought” and keep producing bearish crosses while price continues higher
⚠️ Bull-trap/stop-run behavior: price can dip briefly, trigger shorts, then reclaim 1.365–1.368 and squeeze back upward
⚠️ Event risk: high-impact UK/US data or central bank headlines can invalidate momentum signals quickly
⚠️ Range whipsaw risk: if GBP/USD is rotating within a tight band, crossovers may generate false starts
Potential Next Steps
Add GBP/USD to a watchlist and wait for price to confirm whether the current rally will continue or turn into a pullback.
Technical Analysis
GBP/USD is trending higher on the daily chart, supported by a sequence of higher lows.
Price is approaching resistance at 1.3635–1.3670, while the nearest support sits at 1.3490–1.3520. The stronger support zones below are 1.3280–1.3315 and 1.3160–1.3200.
While price has continued to make higher highs, the Stochastic has made lower highs, forming bearish divergence.
%K has also crossed below %D near the overbought 80 level. This suggests the rally is losing momentum, although sellers still need price to reject 1.3635–1.3670 and break 1.3490 before a larger pullback is confirmed.
Trade Idea: Bullish Continuation Scenario
Setup
The bullish trend can continue if buyers defend 1.3490–1.3520 and push price through 1.3635–1.3670.
Because the Stochastic is weakening, a confirmed daily breakout is preferable to anticipating the move.
Entry
Consider entering long on a daily close above 1.3670, confirming that buyers are breaking out of the recent structure.
Alternatively, enter on a controlled pullback into 1.3490–1.3520 if price stabilizes there and turns back higher.
If price loses that support zone and closes decisively below 1.3490, stand aside and wait for either deeper support to form or a cleaner breakout later.
Stop Loss
For breakout entries: stop on a daily close back below 1.3635. That would invalidate the breakout by showing price could not stay above the former ceiling.
For pullback entries: stop on a daily close below 1.3490. That would invalidate the support-hold idea and show buyers are no longer defending the zone.
Take Profit
Target 1.3800 as the first upside objective. If price reaches that level with strong bullish candles, shallow pullbacks, and continued closes near the daily highs, extend the target to 1.3900.
Bottom Line
The bullish case depends on a daily close above 1.3670. That would confirm the breakout and open a move toward 1.3800.
If price closes below 1.3490, the immediate bullish setup is no longer valid.
Trade Idea: Bearish Pullback Scenario
Setup
A bearish pullback becomes more likely if price fails at 1.3635–1.3670.
The bearish Stochastic crossover and divergence show fading momentum, but sellers need a daily close below 1.3490 to confirm that support has broken.
Entry
Consider entering short on a daily close below 1.3490, confirming that the support zone has failed.
Alternatively, if price pushes into 1.3635–1.3670 and prints a clear bearish rejection candle, enter short on the next daily close back below 1.3600.
If price instead breaks and closes decisively above 1.3670, stand aside, as that would invalidate the bearish pullback idea.
Stop Loss
For breakdown entries: stop on a daily close back above 1.3520. That would invalidate the breakdown by showing price has reclaimed the support zone.
For rejection entries near resistance: stop on a daily close above 1.3670. That would invalidate the bearish idea by confirming buyers have pushed through resistance.
Take Profit
Target 1.3280–1.3315, because that is the next major support area below the current structure and the most likely place where buyers would try to step back in.
Bottom Line
The bearish case needs a rejection from 1.3635–1.3670, followed by a daily close below 1.3490. That would support a pullback toward 1.3280–1.3315.
A daily close above 1.3670 would invalidate the bearish setup.
This content is strictly for informational purposes only and does not constitute as investment advice. Trading any financial market involves risk. Please read our Risk Disclosure to make sure you understand the risks involved.



