


GBP/USD is flashing a classic longer-term trend signal that many traders watch for confirmation of improving momentum.
The move comes after a multi-month swing that included a sharp March drawdown and a steady recovery into late April and May.
Crossovers like this can be meaningful, but they also tend to arrive after a large portion of the move has already occurred.
That makes the next few daily closes important for assessing follow-through versus whipsaw risk.
Welcome to “TA Alert of the Day.” Each day after the market close, MarketMilk scans for popular technical indicator alerts. We use these alerts as the basis for a mini-lesson, breaking down what each alert means, why it matters, and how traders might interpret it. The goal is to help beginner traders not only spot these alerts but also understand the logic behind them and how they can inform trading decisions.
What MarketMilk Has Detected
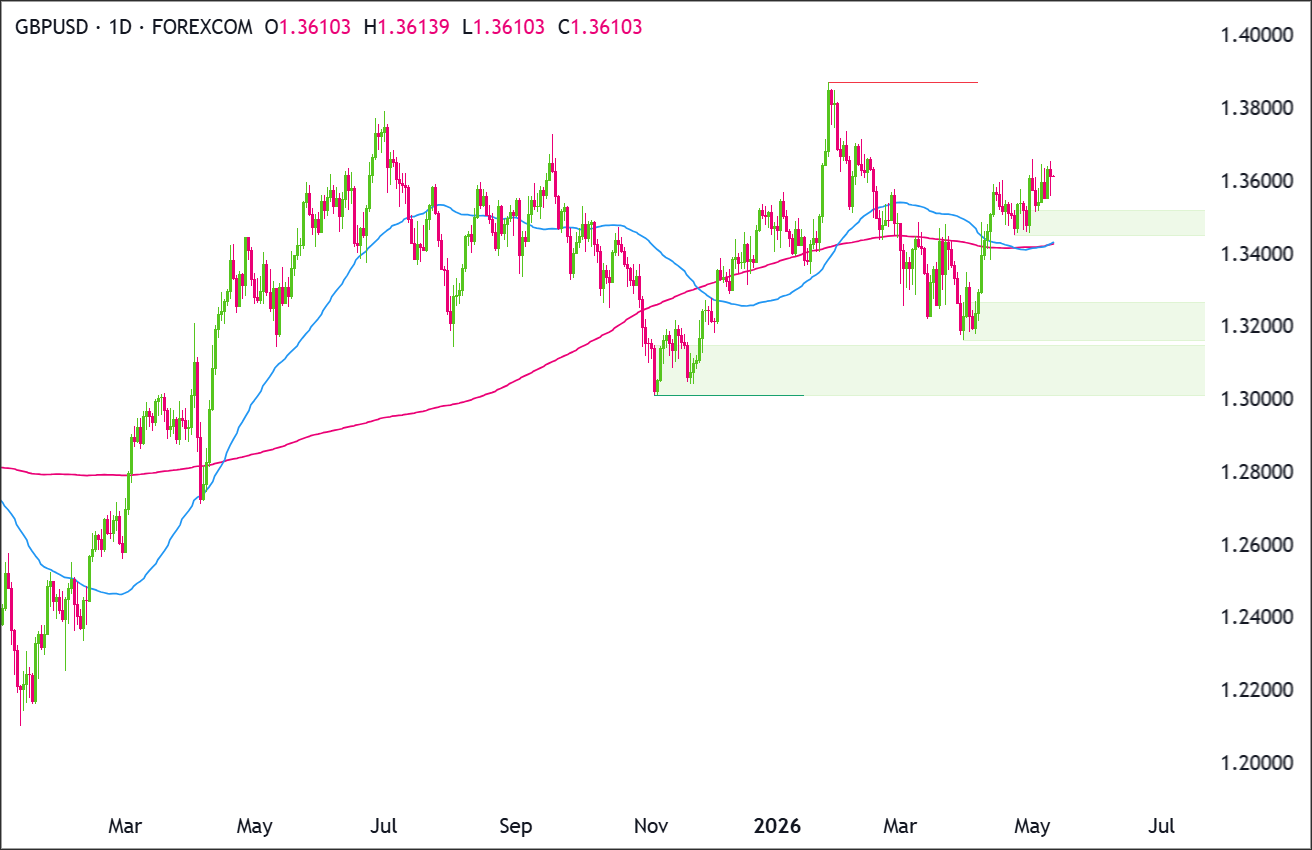
MarketMilk has detected a 50-day simple moving average (SMA) crossing above the 200-day SMA on the daily chart for GBP/USD (a commonly referenced “golden cross” setup).
The crossover is occurring after price rebounded from the March low area near 1.3222–1.3187 and pushed back into the mid-1.36 zone.
Recent price action has repeatedly engaged resistance near 1.3600, a region that has capped upside in recent sessions.
What This Signals
Traditionally, a bullish 50/200 SMA crossover suggests that medium-term momentum is improving compared to the longer-term trend.
If sustained, the move may attract trend-following traders because it suggests recent price momentum is improving relative to the longer-term average.
However, this same pattern can also represent a late-cycle confirmation where a large part of the recovery has already played out before the signal triggers.
In that case, price can stall near nearby resistance (such as the 1.365–1.371 supply zone) and slip back into a range, producing a crossover that quickly “uncrosses” (a whipsaw).Alternatively, a pullback after the crossover is not automatically bearish!
Moving averages can act like dynamic support once market participants start anchoring to them.
A controlled retracement that holds above prior breakout areas (for example 1.350–1.352) can sometimes coincide with a healthier continuation structure than a straight-line rally.
The outcome depends on whether GBP/USD can sustain follow-through, stay supported by the broader trend structure, break above nearby resistance, and continue forming higher lows.
Context and confirmation are essential, especially because the two moving averages are extremely close at the crossover point, which can increase sensitivity to short-term noise.
How It Works
The 50-day SMA tracks the average closing price over roughly the last 50 trading days, while the 200-day SMA represents a longer-term average over about 200 trading days.
A bullish crossover occurs when the shorter SMA rises above the longer SMA, reflecting that more recent prices are, on average, higher than the longer-term baseline.
Because SMAs are calculated from past closing prices, this is a lagging signal: it confirms a shift that has already been developing rather than predicting it in advance.
That’s why crossovers are often most useful when they align with clear market structure (breakouts, higher highs/higher lows, and supportive levels holding) rather than being used in isolation.
Important: Moving-average crossovers are more prone to false signals in sideways markets. When price oscillates around both averages, or when the averages are nearly overlapping (as they are here), small fluctuations can trigger repeated crosses without a durable trend.
What to Look For Before Acting
Do not assume the crossover guarantees an extended uptrend. Consider these factors:
✅ Daily closes holding above the 1.350–1.352 area (recent pivot/support behavior in late April/May)
✅ A clean break and acceptance above 1.365–1.371 (repeated swing-high resistance from February and recent tests)
✅ Fewer long upper wicks near 1.365+ (signs that supply is no longer rejecting rallies)
✅ The 50 SMA starting to separate upward from the 200 SMA (reduces “barely crossed” whipsaw risk)
✅ Higher-low structure remains intact versus the March/early-April basing zone
✅ Confirmation on the Weekly chart (trend alignment and whether weekly structure is also improving)
✅ USD-side drivers: upcoming U.S. inflation/labor data and Fed communications (often key catalysts for sustained GBP/USD trends)
✅ UK-side drivers: BoE expectations and UK inflation/growth surprises (can change rate-differential assumptions quickly)
✅ Risk sentiment and cross-asset confirmation (e.g., broad USD strength/weakness across major pairs)
Risk Considerations
⚠️ Whipsaw risk is elevated when the two SMAs are very close; small pullbacks can flip the signal back
⚠️ Resistance congestion near 1.365–1.371 could trigger failed breakouts and quick reversals
⚠️ The crossover is lagging; entries based purely on the signal may face poorer reward-to-risk if price is extended
⚠️ Event risk (BoE/Fed, CPI) can overwhelm technicals and create volatility on the daily chart
⚠️ In FX, correlation shifts (broad USD moves) can invalidate pair-specific technical setups
Potential Next Steps
GBPUSD remains constructive, but price is still trading below the major swing high near 1.3850.
Keep GBP/USD on a watchlist and monitor whether price can build acceptance above 1.365 or instead rotates back toward 1.350–1.352.
If you use trend signals, consider waiting for additional confirmation such as a successful retest of a key level or clearer separation between the two SMAs.
Regardless of approach, align position sizing with daily volatility and define invalidation levels around the nearest structural supports/resistances rather than relying on the crossover alone.
Trade Idea (Bullish Continuation Scenario)
Setup:
Look for continuation higher if GBPUSD can keep holding above the 1.3430–1.3490 support zone and then push through the near-term ceiling around 1.3620–1.3660.
Entry:
Enter long on a daily close above 1.3660, confirming that buyers are breaking out of the recent consolidation.
Alternatively, enter on a controlled pullback into 1.3430–1.3490 if price stabilizes there and turns back higher.
If price loses that support zone and closes decisively below 1.3430, stand aside and wait for either deeper support to form or a cleaner breakout later.
Stop Loss:
For breakout entries: stop on a daily close back below 1.3490. That would invalidate the breakout by showing price could not stay above the former ceiling.
For pullback entries: stop on a daily close below 1.3380. That would invalidate the support-hold idea and show buyers are no longer defending the zone.
Take Profit:
Target 1.3870, because that is the next clear upside area on the chart and the most natural place for price to retest if the current recovery continues.
Bottom line:
GBPUSD is holding above an important support band and trying to build toward the highs again.
A confirmed move above 1.3660 would strengthen the bullish case and open room toward 1.3850, while a loss of 1.3430 would weaken the recovery setup.
Trade Idea (Bearish Pullback Scenario)
Setup:
Look for a bearish pullback if GBPUSD fails to break through 1.3620–1.3660 and then starts losing the 1.3430–1.3490 support zone, signaling that sellers are taking back short-term control.
Entry:
Enter short on a daily close below 1.3430, confirming that the support zone has failed.
Alternatively, if price pushes into 1.3620–1.3660 and prints a clear bearish rejection candle, enter short on the next daily close back below 1.3490.
If price instead breaks and closes decisively above 1.3660, stand aside, as that would invalidate the bearish pullback idea.
Stop Loss:
For breakdown entries: stop on a daily close back above 1.3490. That would invalidate the breakdown by showing price has reclaimed the support zone.
For rejection entries near resistance: stop on a daily close above 1.3680. That would invalidate the bearish idea by confirming buyers have pushed through resistance.
Take Profit:
Target 1.3200, because that is the next major support area below the current structure and the most likely place where buyers would try to step back in.
Bottom line:
GBPUSD still looks constructive overall, but it is not far from a zone where the recovery could fail.
If price can’t get through 1.3620–1.3660 and then loses 1.3430, the chart opens up for a deeper pullback toward 1.3200.
This content is strictly for informational purposes only and does not constitute as investment advice. Trading any financial market involves risk. Please read our Risk Disclosure to make sure you understand the risks involved.


