





GBP/USD is showing early signs that short-term buying momentum may be returning after its recent pullback.
Price has started to stabilize, while the broader pattern of higher highs and higher lows since the late-June swing low remains intact. This suggests buyers are still holding onto some control despite the recent pause.
The next few daily candles could help show whether this recovery develops into another move higher or whether GBP/USD continues to move sideways for a while longer.
Welcome to “TA Alert of the Day.” Each day after the market close, MarketMilk scans for popular technical indicator alerts. We use these alerts as the basis for a mini-lesson, breaking down what each alert means, why it matters, and how traders might interpret it. The goal is to help beginner traders not only spot these alerts but also understand the logic behind them and how they can inform trading decisions.
What MarketMilk Has Detected
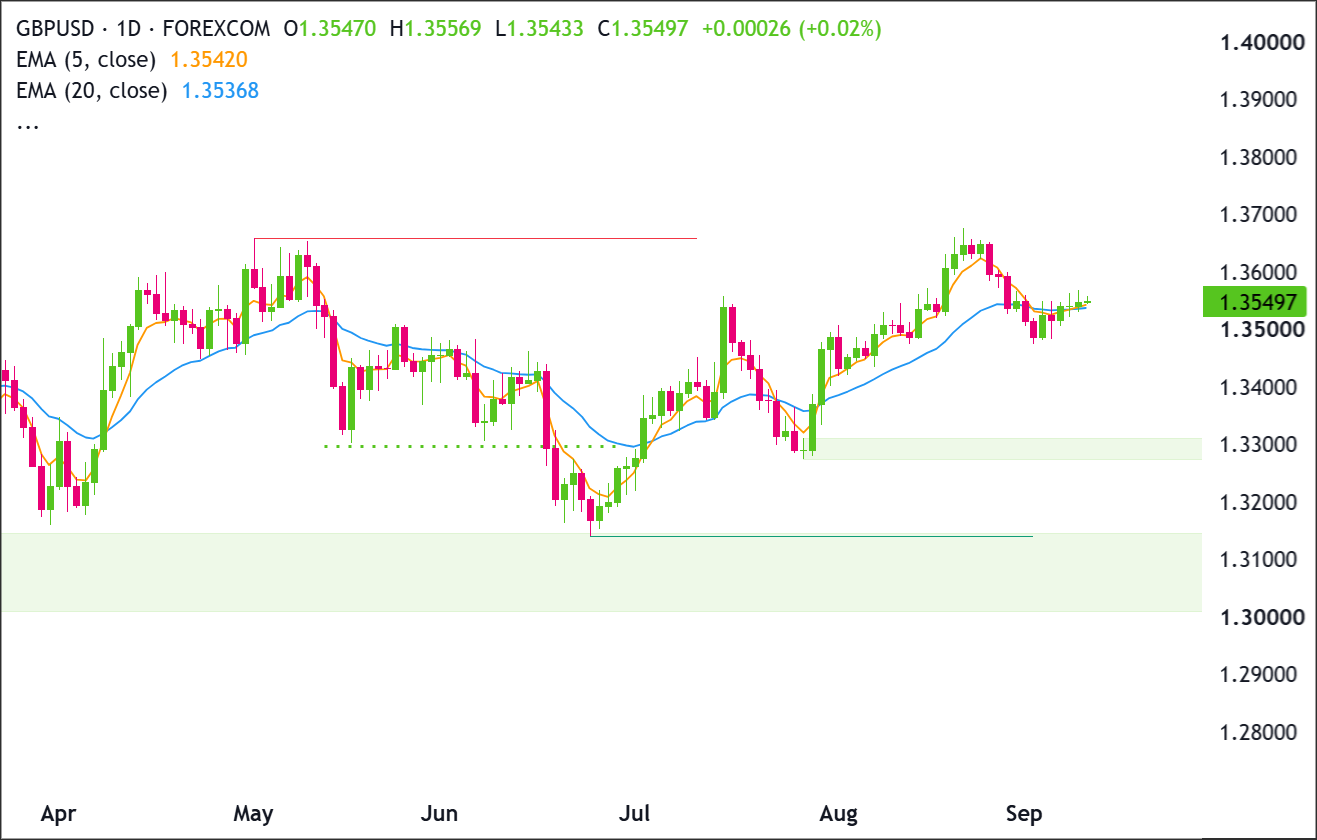
MarketMilk spotted a bullish EMA crossover on the daily chart. This happened when the 5-day EMA moved above the 20-day EMA.
At yesterday’s close, the 5-day EMA was still slightly below the 20-day EMA. At today’s close, it had moved slightly above it.
The difference is small, but the crossover suggests that short-term price momentum may be starting to improve.
What This Signals
A bullish 5/20 EMA crossover means the 5-day EMA has moved above the 20-day EMA. This can be an early sign that short-term momentum is getting stronger.
If price keeps moving higher, some traders may see the crossover as confirmation that buyers are gaining control.
But EMA crossovers are not always reliable, especially when the two averages are very close together and price is moving sideways.In that kind of market, the signal can quickly fail. Price may move higher for a short time, then fall back into its previous range.
The crossover could also simply be part of a short-term bounce rather than the start of a new uptrend. If price loses momentum, the two EMAs may flatten out or cross back again.
That is why traders often look for confirmation after the crossover. Continued gains, a move above nearby resistance, and stronger price movement can all help show whether the bullish signal has real strength.
How It Works
Exponential moving averages, or EMAs, help traders see the direction of a trend by giving more importance to recent prices.
The 5-day EMA reacts quickly to short-term price changes, while the 20-day EMA moves more slowly and shows the broader trend.
A bullish crossover happens when the 5-day EMA moves above the 20-day EMA. This can suggest that recent price action is getting stronger.
But EMA crossovers are lagging signals because they are based on prices that have already happened. In other words, they confirm that momentum has started to improve rather than predicting a move before it begins.
The signal can become more meaningful if price also holds above the moving averages and breaks through nearby resistance instead of quickly falling back below them.
Important: In ranging markets, 5/20 crossovers can generate multiple false signals. The reliability tends to improve when the crossover is accompanied by clear higher highs/higher lows and when price breaks or holds above a well-defined resistance zone.
What to Look For Before Acting
Don’t assume the bullish crossover automatically means GBP/USD will keep rising. You may want to watch a few things before treating the signal as stronger confirmation:
✅ Whether price can close above both EMAs for several days, rather than quickly falling back below them.
✅ A move above the recent resistance area around 1.3606–1.3655, which could strengthen the bullish case.
✅ How price behaves around 1.350–1.352 if it pulls back.
✅ Whether the two EMAs begin to move farther apart and slope higher, instead of flattening out.
✅ Whether price starts forming higher lows, which can be a sign that buyers are gaining strength.
✅ Whether the Weekly chart also supports the bullish move, such as price breaking above important swing highs.
✅ How price reacts if it reaches the previous high area near 1.3676.
✅ Any major UK or U.S. economic reports or central bank comments, since these can quickly change the market’s direction.
Risk Considerations
⚠️ False signals are possible when the two EMAs are very close together, since small price moves can cause them to cross back and forth.
⚠️ If GBP/USD falls below the 1.350–1.352 area, it could weaken the idea that short-term momentum is improving.
⚠️ Resistance around 1.360–1.366 could stop the move higher and turn the bullish crossover into a short-lived bounce.
⚠️ Major economic news or central bank announcements can cause sharp price moves and sudden reversals that EMAs may only reflect after they happen.
Potential Next Steps
Add GBP/USD to a watchlist and watch how price behaves around its recent highs and nearby support.
Technical Analysis
GBP/USD has been trending higher since the late-June swing low near 1.3160–1.3180.
Since then, each major pullback has generally stopped above the previous low, while rallies have pushed to new highs. This pattern of higher highs and higher lows is a basic sign of an uptrend.
GBP/USD has started to settle down after pulling back from the late-August high near 1.3650–1.3670.
Sellers pushed price down toward 1.3490–1.3500, but they were unable to keep pushing it lower.
Since then, price has started moving sideways and slightly higher. This suggests buyers are trying to defend the recent low. The broader pattern of higher lows also remains intact.
Buyers now need to push price back above 1.3600 and then break 1.3650–1.3670.
Sellers would need to push price below 1.3480–1.3500 to show that the recent recovery is starting to weaken.
Trade Idea: Bullish Continuation Scenario
Setup
The bullish idea is based on the uptrend that has been developing since late June. GBP/USD continues to make higher highs and higher lows, and the recent 5/20 EMA bullish crossover adds another positive sign.
For this setup to stay healthy, price needs to hold around 1.3480–1.3535. Buyers then need to break above the recent high around 1.3650–1.3670.
A daily close above this area would give stronger confirmation that the uptrend is continuing.
Entry
Consider entering long on a daily close above 1.3670, confirming that buyers have broken through the recent high.
Alternatively, enter on a controlled pullback into 1.3500–1.3535 if price settles there and starts moving higher again.
If price loses this support area and closes clearly below 1.3480, stand aside and wait for either stronger support lower down or another breakout attempt later.
Stop Loss
For breakout entries: stop on a daily close back below 1.3650. This would invalidate the breakout because price would have failed to stay above the previous high.
For pullback entries: stop on a daily close below 1.3480. This would invalidate the idea that buyers are successfully defending the recent support area.
Take Profit
Target 1.3870, which was a swing high in late January. This is the next major upside level to watch if GBP/USD breaks above its recent highs and continues higher.
Bottom Line
The bullish setup remains attractive while GBP/USD stays above 1.3480–1.3500. The higher-high, higher-low trend is still in place, and the 5-day EMA crossing above the 20-day EMA suggests short-term momentum is improving.
A daily close above 1.3670 would strengthen the bullish case and open the door toward 1.3870. A daily close below 1.3480 would invalidate the near-term bullish setup.
Trade Idea: Bearish Pullback Scenario
Setup
The bearish idea would start to make more sense if GBP/USD struggles to move above 1.3600–1.3670 and sellers begin pushing price lower again.
The key support area is around 1.3480–1.3500. If this area breaks, it would be an early sign that the recent higher-low pattern is weakening.
This could allow price to fall toward the first green demand zone around 1.3280–1.3320.
Entry
Consider entering short on a daily close below 1.3480, confirming that the recent support area has broken.
Alternatively, if price moves back into 1.3600–1.3670 and shows a clear bearish rejection, enter short on the next daily close back below 1.3550.
If price instead breaks and closes clearly above 1.3670, stand aside because this would invalidate the bearish pullback idea.
Stop Loss
For breakdown entries: stop on a daily close back above 1.3500. This would invalidate the breakdown because price would have moved back above the broken support area.
For rejection entries near resistance: stop on a daily close above 1.3670. This would invalidate the bearish setup because buyers would have successfully broken through resistance.
Take Profit
Target 1.3280–1.3320, because this is the nearest green demand zone below the current price and an area where buyers may step back in.
If 1.3280–1.3320 breaks clearly, the larger green demand zone around 1.3010–1.3140 would become the next downside area to watch.
Bottom Line
The bearish case would become stronger if GBP/USD fails around 1.3600–1.3670 and then closes below 1.3480. This would suggest sellers are starting to take control of the short-term move.
A break below 1.3480 could open the door toward 1.3280–1.3320, with 1.3010–1.3140 as a deeper target if selling continues. A daily close above 1.3670 would invalidate the bearish setup.
This content is strictly for informational purposes only and does not constitute as investment advice. Trading any financial market involves risk. Please read our Risk Disclosure to make sure you understand the risks involved.



