





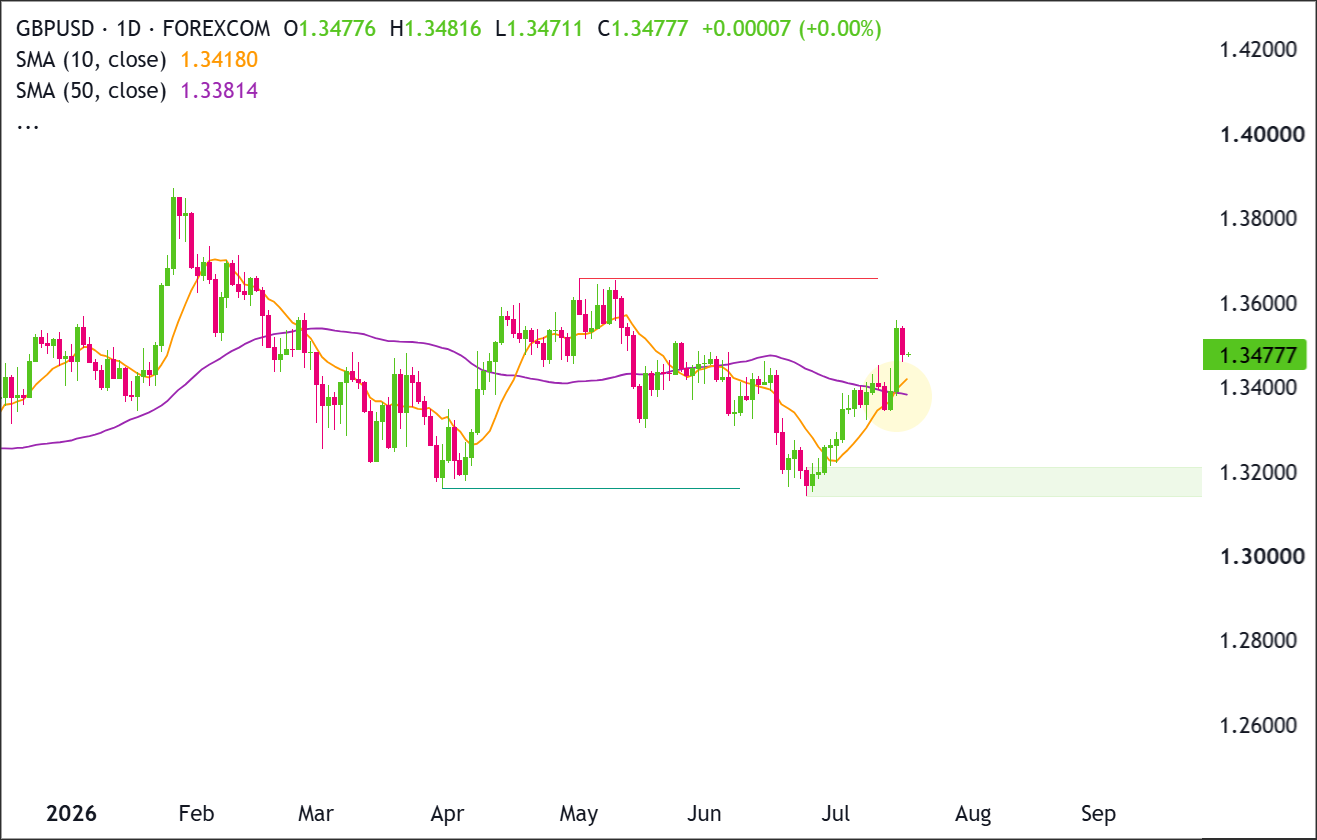
GBP/USD has triggered a bullish 10/50 SMA crossover, signaling that short-term momentum is strengthening relative to the medium-term trend.
The pair has also pushed back above 1.3500 following a steady recovery from its late-June lows.
The key question now is whether buyers can sustain that momentum and keep the 10-day SMA above the 50-day SMA, or whether the move fades and price slips back into consolidation.
Welcome to “TA Alert of the Day.” Each day after the market close, MarketMilk scans for popular technical indicator alerts. We use these alerts as the basis for a mini-lesson, breaking down what each alert means, why it matters, and how traders might interpret it. The goal is to help beginner traders not only spot these alerts but also understand the logic behind them and how they can inform trading decisions.
What MarketMilk Has Detected
MarketMilk has detected a 10 SMA crossing above the 50 SMA on the daily timeframe, a classic bullish moving-average crossover.
What This Signals
Traditionally, a 10/50 SMA bullish crossover suggests that shorter-term price action has improved enough to tilt the intermediate trend upward.
If the move is sustained, it can attract trend-followers who view the crossover as confirmation that the recovery from the 1.3167–1.3200 base is broadening into a more durable uptrend phase.
However, this same pattern can also represent late confirmation after a sharp bounce—especially when the crossover happens near resistance.In that case, prices sometimes coincide with a “pop-and-drop” dynamic where price briefly holds above the averages, then reverses back toward them, creating whipsaw for traders who enter solely on the crossover.
Alternatively, the crossover may function more as a mean reversion signal than a trend signal if GBP/USD remains capped below the 1.3595–1.3658 supply zone.
A failure to build acceptance above 1.3500 could shift focus back to the midrange around 1.3400, where price traded repeatedly in late June and early July.The outcome depends heavily on follow-through above nearby resistance, the slope/spacing of both SMAs, and whether volatility and participation remain supportive.
Context and confirmation are essential, because moving averages can flip direction quickly when markets transition back into consolidation.
How It Works
A moving-average crossover compares two smoothed price series: the 10-day SMA (more responsive to recent candles) and the 50-day SMA (slower, often used to define the intermediate trend).
When the faster average crosses above the slower one, it indicates recent closes have been strong enough, for long enough, to lift the short-term trend measure over the medium-term baseline.Because SMAs are calculated from past closing prices, crossovers are confirmation tools rather than early-warning signals.
They often work best when price is breaking out from a base or transitioning into a new trend, and they tend to struggle when price is choppy and mean-reverting.
Important: crossover reliability typically improves when (1) the 50 SMA flattens and starts turning up, (2) price holds above both averages on subsequent pullbacks, and (3) the breakout occurs away from major resistance rather than directly into it.
What to Look For Before Acting
Don’t assume the crossover guarantees continuation higher. Consider these factors:
✅ Whether GBP/USD can hold above 1.3500–1.3535 (former congestion) on daily closes
✅ A pullback that respects the 10 SMA as dynamic support rather than slicing back below it
✅ The 50 SMA beginning to flatten/turn up (reduces “one-candle crossover” risk)
✅ A clean break or acceptance above 1.3595–1.3658 (key prior swing resistance zone)
✅ Signs of higher highs/higher lows continuing from the late-June base near 1.3167–1.3205
✅ Confirmation from a higher timeframe: check the Weekly chart for trend alignment and overhead resistance
✅ Upcoming UK/US macro catalysts (rate expectations, inflation/labor data) that can override technical signals
✅ Broader USD tone (risk sentiment and major USD pairs) to see if the move is GBP-led or USD-led
Risk Considerations
⚠️ Whipsaw risk: moving-average crossovers can fail quickly in range conditions, snapping back below the averages
⚠️ Lag risk: the crossover may occur after a large portion of the rebound has already happened
⚠️ Overhead resistance: the 1.3595–1.3658 zone may cap price and trigger profit-taking
⚠️ Event risk: FX can spike on macro surprises, invalidating technical setups
⚠️ False-break risk: today’s strong candle could be a temporary expansion that mean-reverts toward 1.3400–1.3450
Potential Next Steps
Add GBP/USD to your watchlist and monitor whether it holds above 1.3500 while the 10 SMA remains above the 50 SMA.
The rebound from 1.3150–1.3210 produced a sequence of higher lows and accelerated through the 1.3380–1.3420 area.
Price then reached approximately 1.3530–1.3550, where selling pressure interrupted the advance.
Buyers now need to hold above 1.3380–1.3420 and produce a daily close above 1.3550 to confirm another leg higher. A close below 1.3380 would weaken the recovery and expose lower support.
Trade Idea: Bullish Continuation Scenario
Setup
The bullish setup remains valid while GBP/USD holds the 1.3380–1.3420 support zone containing the rising 10-day SMA at 1.3418 and the 50-day SMA at 1.3381.
A daily close above 1.3550 would clear the recent recovery high and open the way toward the larger resistance zone at 1.3650–1.3660.
Entry
Consider entering long on a daily close above 1.3550, confirming that buyers are breaking out of the recent structure.
Alternatively, enter on a controlled pullback into 1.3380–1.3420 if price stabilizes there and turns back higher.
If price loses that support zone and closes decisively below 1.3380, stand aside and wait for either deeper support to form or a cleaner breakout later.
Stop Loss
For breakout entries: stop on a daily close back below 1.3470. That would invalidate the breakout by showing price could not stay above the former ceiling.
For pullback entries: stop on a daily close below 1.3380. That would invalidate the support-hold idea and show buyers are no longer defending the zone.
Take Profit
Target 1.3650–1.3660, because that is the next clear upside area on the chart and the most natural place for price to retest if the current recovery continues.
Bottom Line
The bullish case strengthens on a daily close above 1.3550, particularly while price remains above the 10-day SMA at 1.3418 and the 50-day SMA at 1.3381. That breakout would place 1.3650–1.3660 in focus.
A decisive close below 1.3380 would invalidate the immediate continuation setup by breaking the moving-average support cluster and weakening the developing higher-low structure.
Trade Idea: Bearish Pullback Scenario
Setup
The bearish setup depends on GBP/USD failing beneath the 1.3530–1.3550 resistance zone and then losing the moving-average support area at 1.3380–1.3420.
A close below the 50-day SMA at 1.3381 would indicate that the recent move above both moving averages has failed and could shift attention back toward the 1.3150–1.3210 demand zone.
Entry
Consider entering short on a daily close below 1.3380, confirming that the support zone has failed.
Alternatively, if price pushes into 1.3530–1.3550 and prints a clear bearish rejection candle, enter short on the next daily close back below 1.3470.
If price instead breaks and closes decisively above 1.3550, stand aside, as that would invalidate the bearish pullback idea.
Stop Loss
For breakdown entries: stop on a daily close back above 1.3420. That would invalidate the breakdown by showing price has reclaimed the support zone.
For rejection entries near resistance: stop on a daily close above 1.3550. That would invalidate the bearish idea by confirming buyers have pushed through resistance.
Take Profit
Target 1.3150–1.3210, because that is the next major support area below the current structure and the most likely place where buyers would try to step back in.
Bottom Line
The bearish case requires another rejection from 1.3530–1.3550, followed by a daily close below 1.3380. That would place price back beneath both the 10-day SMA at 1.3418 and the 50-day SMA at 1.3381.
A confirmed breakdown would expose the 1.3150–1.3210 demand zone. A decisive daily close above 1.3550 would invalidate the bearish pullback scenario.
This content is strictly for informational purposes only and does not constitute as investment advice. Trading any financial market involves risk. Please read our Risk Disclosure to make sure you understand the risks involved.



