





GBP/JPY has continued to push higher after its recent recovery, putting the pair in a position where the move may be starting to look stretched.
That doesn’t automatically mean a reversal is coming, but it does give traders a reason to watch closely.
The key question now is whether buyers can keep momentum going, or whether the rally starts to fade and pull back.
Welcome to “TA Alert of the Day.” Each day after the market close, MarketMilk scans for popular technical indicator alerts. We use these alerts as the basis for a mini-lesson, breaking down what each alert means, why it matters, and how traders might interpret it. The goal is to help beginner traders not only spot these alerts but also understand the logic behind them and how they can inform trading decisions.
What MarketMilk Has Detected
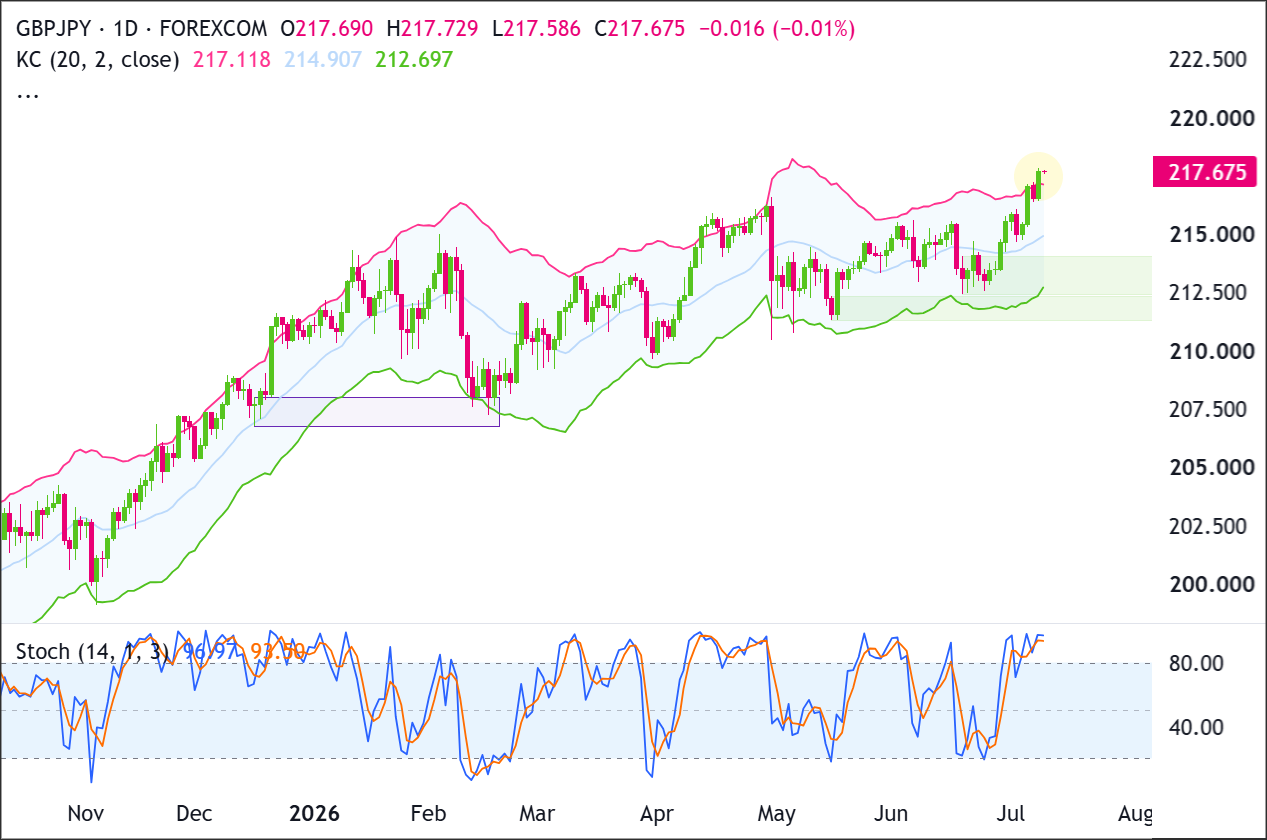
MarketMilk detected that GBP/JPY closed above the upper Keltner Channel (20, 10, 2) on the daily chart.
GBP/JPY has bounced back from its late-April drop and continued moving higher into early July. It is now back near a recent high area, where traders may watch to see whether the rally keeps going or starts to lose steam.
What This Signals
Traditionally, a close above the upper Keltner Channel can attract mean-reversion traders because it suggests price is moving faster than its recent “typical” range around the 20-period baseline.
In that framing, the move can sometimes coincide with overbought momentum conditions and may set the stage for a pullback toward the channel middle (currently around 215.14) if the move is not sustained.
However, this same pattern can also represent trend strength rather than exhaustion.In persistent uptrends, price can “walk the band,” where repeated closes near or above the upper channel coincide with continued buying pressure and only shallow dips.
In that scenario, what looks stretched can remain stretched, and fading the signal too early can be costly.
Alternatively, the breach can sometimes coincide with a bull-trap style push, where prices briefly pop above the volatility envelope, attract breakout buyers, then slip back inside the channel and accelerate lower as late buyers exit.
If GBP/JPY fails to hold the breakout area and quickly reverts below ~217.57, traders often treat that as evidence the move lacked acceptance.
The outcome depends heavily on trend context, volatility regime, and where the close sits relative to nearby structure (recent swing highs/lows and prior congestion). Context and confirmation are essential, especially after a multi-week push from the May lows into the July highs.
How It Works
Keltner Channel plots a central moving average (typically an EMA) with upper and lower bands derived from volatility (commonly ATR-based).
With settings (20, 10, 2), the channel is measuring a 20-period baseline and projecting bands using recent range/volatility over the lookback, multiplied by 2.
A close above the upper band signals that price has exceeded what the indicator models as a “normal” move for the current volatility environment.
Because the bands expand and contract with volatility, Keltner signals are condition alerts rather than directional forecasts.
They are often used to evaluate whether price is extended (potential mean reversion) or whether volatility is expanding with trend continuation.
Important: A Keltner breach can persist for multiple sessions in strong trends, and a single close outside the channel has a higher false-signal rate when the market is already trending and volatility is rising. Reliability typically improves when you combine the breach with price structure (breakout acceptance vs rejection) and broader market conditions.
What to Look For Before Acting
Don’t assume a reversal is imminent. Consider these factors:
✅ Whether GBP/JPY holds above the upper band (~217.57) for another daily close, or snaps back inside the channel
✅ Signs of rejection (e.g., long upper wick near 217.8 and a close back below the band)
✅ Reaction around the 217.1–217.8 zone (recent breakout/pressure area) for acceptance vs failure
✅ Whether price drifts back toward the Keltner middle (~215.14) in an orderly pullback (often healthier) versus a sharp drop (often risk-off)
✅ Nearby support reference points from recent structure: ~216.55 (prior close) and the early-July pivot area near ~215.0–215.4
✅ Alignment on higher timeframe: check the 4-Hour and/or Weekly for trend state and whether momentum is accelerating or fading
✅ Volatility behavior: are daily ranges expanding (trend-strength) or spiking and then contracting (often exhaustion)
✅ Macro catalysts relevant to GBP/JPY (BoE/BoJ policy messaging, UK inflation/jobs, Japan rates commentary or intervention risk) that could drive a volatility reset
Risk Considerations
⚠️ Band-walk risk: price can remain above the upper Keltner band during strong trends, making early shorts vulnerable
⚠️ Whipsaw risk: a brief dip back inside the channel can be followed by another push higher
⚠️ Volatility risk: GBP/JPY can reprice quickly around central bank headlines, overpowering indicator-based setups
⚠️ Level ambiguity: with price at fresh local highs (217.8 area), nearby resistance can be less well-defined, complicating stop placement
Potential Next Steps
Keep GBP/JPY on your radar and watch whether it stays above the upper Keltner band or falls back inside the channel over the next few trading sessions.
Recent price action shows buyers pushing GBP/JPY into the upper Keltner Channel area, but price is now testing the 217.700-218.000 ceiling after a strong July advance.
Momentum remains firm, and Stochastic is elevated, so buyers need a clean breakout above 218.000 to prove continuation.
Sellers need price to reject this zone and lose 214.900-215.200 to shift control.
Trade Idea: Bullish Continuation Scenario
Setup
The bullish setup depends on GBP/JPY holding above the Keltner Channel midline support around 214.900-215.200 and breaking through the current resistance zone at 217.700-218.000.
A daily close above 218.000 would confirm that buyers are extending the trend above the upper Keltner Channel rather than simply overextending into resistance.
Entry
Consider entering long on a daily close above 218.000, confirming that buyers are breaking out of the recent structure.
Alternatively, enter on a controlled pullback into 214.900-215.200 if price stabilizes there and turns back higher.
If price loses that support zone and closes decisively below 214.900, stand aside and wait for either deeper support to form or a cleaner breakout later.
Stop Loss
For breakout entries: stop on a daily close back below 217.100. That would invalidate the breakout by showing price could not stay above the former ceiling and upper Keltner Channel area.
For pullback entries: stop on a daily close below 214.900. That would invalidate the support-hold idea and show buyers are no longer defending the zone.
Take Profit
Target 220.000, because that is the next clear upside area on the chart and the most natural place for price to retest if the current recovery continues.
Bottom Line
The bullish case improves if GBP/JPY closes above 218.000 and holds above the former resistance area. That would keep price riding the upper side of the Keltner Channel and open the door for a continuation move toward 220.000.
The bullish idea weakens if price fails back below 217.100, and it is invalidated more clearly if price loses 214.900. A close below 214.900 would suggest the breakout attempt has failed and that a deeper pullback may be developing.
Trade Idea: Bearish Pullback Scenario
Setup
The bearish setup depends on GBP/JPY failing at the 217.700-218.000 resistance zone while price is stretched near the upper Keltner Channel.
Sellers need a daily close below 214.900 to confirm that the Keltner Channel midline and nearby support have failed.
Entry
Consider entering short on a daily close below 214.900, confirming that the support zone has failed.
Alternatively, if price pushes into 217.700-218.000 and prints a clear bearish rejection candle, enter short on the next daily close back below 217.100.
If price instead breaks and closes decisively above 218.000, stand aside, as that would invalidate the bearish pullback idea.
Stop Loss
For breakdown entries: stop on a daily close back above 215.200. That would invalidate the breakdown by showing price has reclaimed the support zone.
For rejection entries near resistance: stop on a daily close above 218.000. That would invalidate the bearish idea by confirming buyers have pushed through resistance.
Take Profit
Target 212.500-212.700, because that is the next major support area below the current structure and aligns with the lower Keltner Channel zone where buyers would most likely try to step back in.
Bottom Line
The bearish case is strongest if GBP/JPY rejects 217.700-218.000 and then closes below 214.900. That would show price failing from the upper Keltner Channel area and shifting back toward mean-reversion pressure.
A breakdown below 214.900 would put 212.500-212.700 in focus as the next downside target. The bearish idea is invalidated if price closes decisively above 218.000, because that would confirm buyers are still in control.
This content is strictly for informational purposes only and does not constitute as investment advice. Trading any financial market involves risk. Please read our Risk Disclosure to make sure you understand the risks involved.



