


GBP/CHF is trading under pressure after failing near the 1.0660-1.0680 resistance zone and sliding back toward key support around 1.0490-1.0500.
The recent pullback has pushed the Stochastic oscillator into oversold territory, suggesting downside momentum may be stretched in the short term.
Welcome to “TA Alert of the Day.” Each day after the market close, MarketMilk scans for popular technical indicator alerts. We use these alerts as the basis for a mini-lesson, breaking down what each alert means, why it matters, and how traders might interpret it. The goal is to help beginner traders not only spot these alerts but also understand the logic behind them and how they can inform trading decisions.
What MarketMilk Has Detected
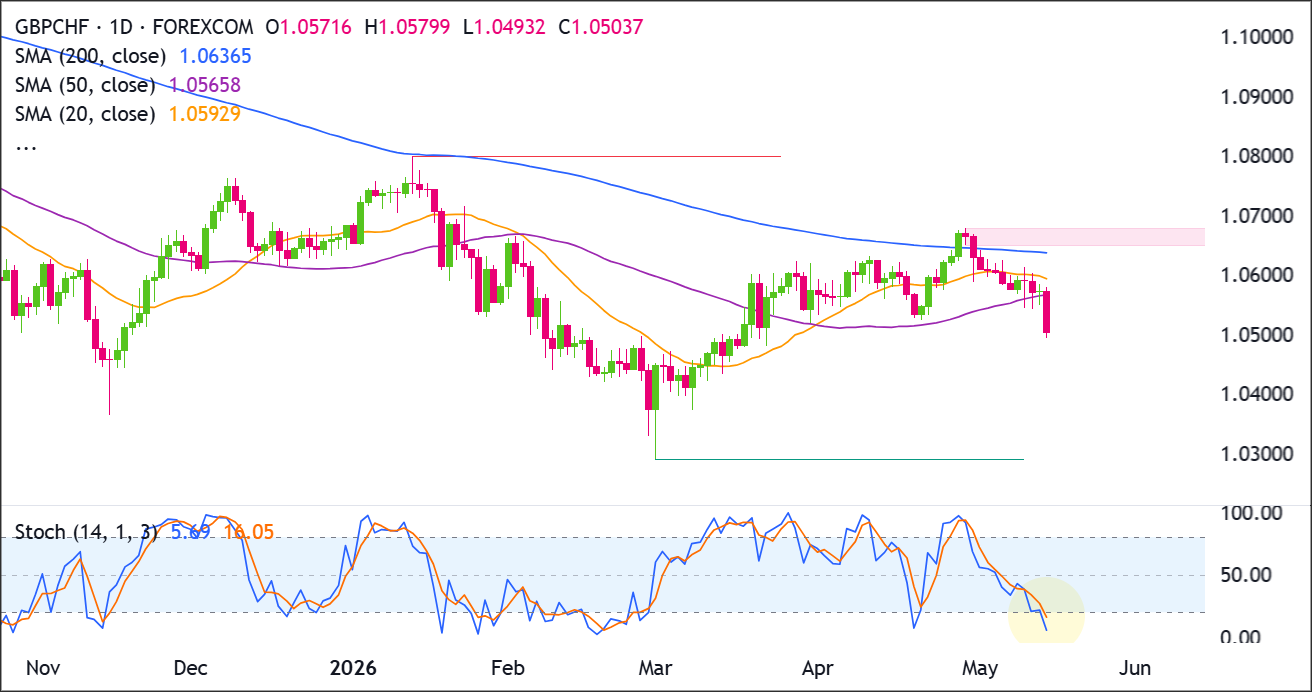
MarketMilk detected that Stochastic(14,3,3) has reached oversold, with the %K reading falling to 5 and %D falling to 16 (both below the 20 threshold).
This shows that short-term downside momentum has become stretched after the recent selloff toward 1.0490-1.0500.
What This Signals
Traditionally, a Stochastic oversold reading can attract dip-buying interest, especially when it occurs near established support.
In that context, the development suggests that downside momentum has accelerated to a level that often marks at least a tradable pause or a bounce attempt if the move is sustained back above nearby resistance levels.
However, this same pattern can also represent persistent bearish momentum rather than a clean reversal signal.In strong downswings, Stochastic can remain oversold for several candles, and brief upticks can fail quickly, creating rebounds that fade near former support (now resistance), such as the 1.057–1.060 zone.
Alternatively, if price holds the 1.049–1.050 area but Stochastic begins to base and turn up, traders often interpret that as waning selling pressure.
A follow-through close back above broken short-term levels (for example, reclaiming 1.054–1.057) can sometimes coincide with mean-reversion back into the prior range.
The outcome depends heavily on trend context, where price is relative to support/resistance, and whether momentum shifts from “oversold” to “recovering” via a sustained turn higher.
How It Works
The Stochastic (14,3,3) oscillator compares the current close to the recent high-low range over the last 14 periods, then smooths the reading to create %K and %D.
Values near 0 indicate the close is occurring near the bottom of its recent range, while values near 100 indicate it is closing near the top.
An oversold condition is commonly flagged when Stochastic drops below 20.
This measures price location within its recent range (momentum/positioning), and it can be most informative when aligned with a clearly defined support zone and subsequent bullish price confirmation.
Important: Oversold does not automatically mean “ready to rally.” In trending markets, Stochastic can stay oversold while price continues to grind lower, so confirmation from price structure (and not the oscillator alone) typically improves reliability.
What to Look For Before Acting
Do not assume an immediate reversal. Consider these factors:
✅ A Stochastic “hook” higher (e.g., %K turning up and ideally crossing back above %D) while price stabilizes
✅ Evidence that 1.049–1.050 is holding (smaller real bodies, long lower wicks, or multiple closes above this area)
✅ A reclaim of nearby structure such as 1.054–1.057, suggesting the breakdown is being absorbed
✅ Whether the next push down makes a lower low in price but Stochastic makes a higher low (a potential bullish divergence setup)
✅ Watch how price reacts if it retests the 1.0585–1.0600 area (prior congestion) as first meaningful resistance
✅ Alignment check on the Weekly timeframe (trend bias and whether price is approaching weekly support)
✅ Risk sentiment and CHF demand (safe-haven flows can keep downside pressure in place even with oversold momentum)
✅ The UK/Swiss macro calendar (surprises in CPI, central-bank communication, or risk events can override oscillator signals)
Risk Considerations
⚠️ Oversold can persist: Stochastic may stay below 20 while price continues to make lower lows
⚠️ False bounce risk: quick rebounds can fail at 1.054–1.057 or 1.0585–1.0600 if sellers defend prior breakdown zones
⚠️ Repricing events: FX can reprice sharply around macro headlines, reducing the usefulness of oscillator timing
⚠️ Support is a zone, not a line: the market can briefly pierce 1.049–1.050 before choosing direction
Potential Next Steps
Keep GBP/CHF on a watchlist for signs of stabilization around 1.049–1.050 and a momentum turn (Stochastic curling up).
If a bounce develops, monitor how price behaves into 1.054–1.057 first, then 1.0585–1.0600 as the next resistance band.If price continues to post soft closes near the lows, traders may want to wait for stronger confirmation.
Regardless of approach, use predefined risk limits and position sizing that accounts for potential volatility around macro catalysts.
Trade Idea: Bullish Continuation Scenario
Setup
The bullish setup depends on GBP/CHF defending the current support zone around 1.0490-1.0500 and then reclaiming the moving-average cluster near 1.0565-1.0595.
A stronger bullish confirmation would come from a daily close above the resistance zone at 1.0660-1.0680, which would show buyers have broken through the recent ceiling and reclaimed the area near the 200-day SMA around 1.0637.
Entry
Consider going long on a daily close above 1.0680, confirming that buyers are breaking out of the recent structure.
Alternatively, enter on a controlled pullback into 1.0490-1.0500 if price stabilizes there and turns back higher.
If price loses that support zone and closes decisively below 1.0490, stand aside and wait for either deeper support to form or a cleaner breakout later.
Stop Loss
For breakout entries: stop on a daily close back below 1.0635. That would invalidate the breakout by showing price could not stay above the former ceiling.
For pullback entries: stop on a daily close below 1.0490. That would invalidate the support-hold idea and show buyers are no longer defending the zone.
Take Profit
Target 1.0780, because that is the next clear upside area on the chart and the most natural place for price to retest if the current recovery continues.
Bottom Line
The bullish case improves only if GBP/CHF can hold 1.0490-1.0500 and recover back through 1.0565-1.0595.
A daily close above 1.0680 would be the stronger confirmation that buyers have broken the recent resistance structure.
Above 1.0680, the next upside target is 1.0780. The bullish idea weakens on a close back below 1.0635 after breakout, and it is invalidated for pullback entries if price closes below 1.0490.
Trade Idea: Bearish Pullback Scenario
Setup
The bearish setup is based on GBP/CHF failing below the resistance cluster around 1.0565-1.0595 after rejecting the broader supply zone near 1.0660-1.0680.
Sellers gain stronger control if price breaks and closes below 1.0490, because that would confirm the current support area has failed and open the door toward 1.0400.
Entry
Consider entering short on a daily close below 1.0490, confirming that the support zone has failed.
Alternatively, if price pushes into 1.0565-1.0595 and prints a clear bearish rejection candle, enter short on the next daily close back below 1.0565.
If price instead breaks and closes decisively above 1.0680, stand aside, as that would invalidate the bearish pullback idea.
Stop Loss
For breakdown entries: stop on a daily close back above 1.0500. That would invalidate the breakdown by showing price has reclaimed the support zone.
For rejection entries near resistance: stop on a daily close above 1.0595. That would invalidate the bearish idea by confirming buyers have pushed through resistance.
Take Profit
Target 1.0400, because that is the next major support area below the current structure and the most likely place where buyers would try to step back in.
Bottom Line
The bearish case stays active while GBP/CHF remains below 1.0565-1.0595 and continues to reject the broader resistance zone around 1.0660-1.0680.
A daily close below 1.0490 would confirm a breakdown from the current support area.
Below 1.0490, the downside target is 1.0400.
The bearish pullback idea is invalidated if price closes decisively above 1.0680, as that would show buyers have cleared the recent resistance zone.


