





EUR/USD has extended its recovery with a sharp push into the 1.1660–1.1680 area, where price is now testing the strength of the latest breakout.
The most recent closed daily candle finished near its highs and above the upper Keltner Channel, highlighting strong buying pressure, while MACD continues to support the bullish momentum.
Even so, the speed of the advance leaves room for either continued upside if buyers can hold the breakout or a pullback if price slips back below recent support.
The next few sessions should help determine whether this move can build toward the prior highs or begin to cool after the recent surge.
Welcome to “TA Alert of the Day.” Each day after the market close, MarketMilk scans for popular technical indicator alerts. We use these alerts as the basis for a mini-lesson, breaking down what each alert means, why it matters, and how traders might interpret it. The goal is to help beginner traders not only spot these alerts but also understand the logic behind them and how they can inform trading decisions.
What MarketMilk Has Detected
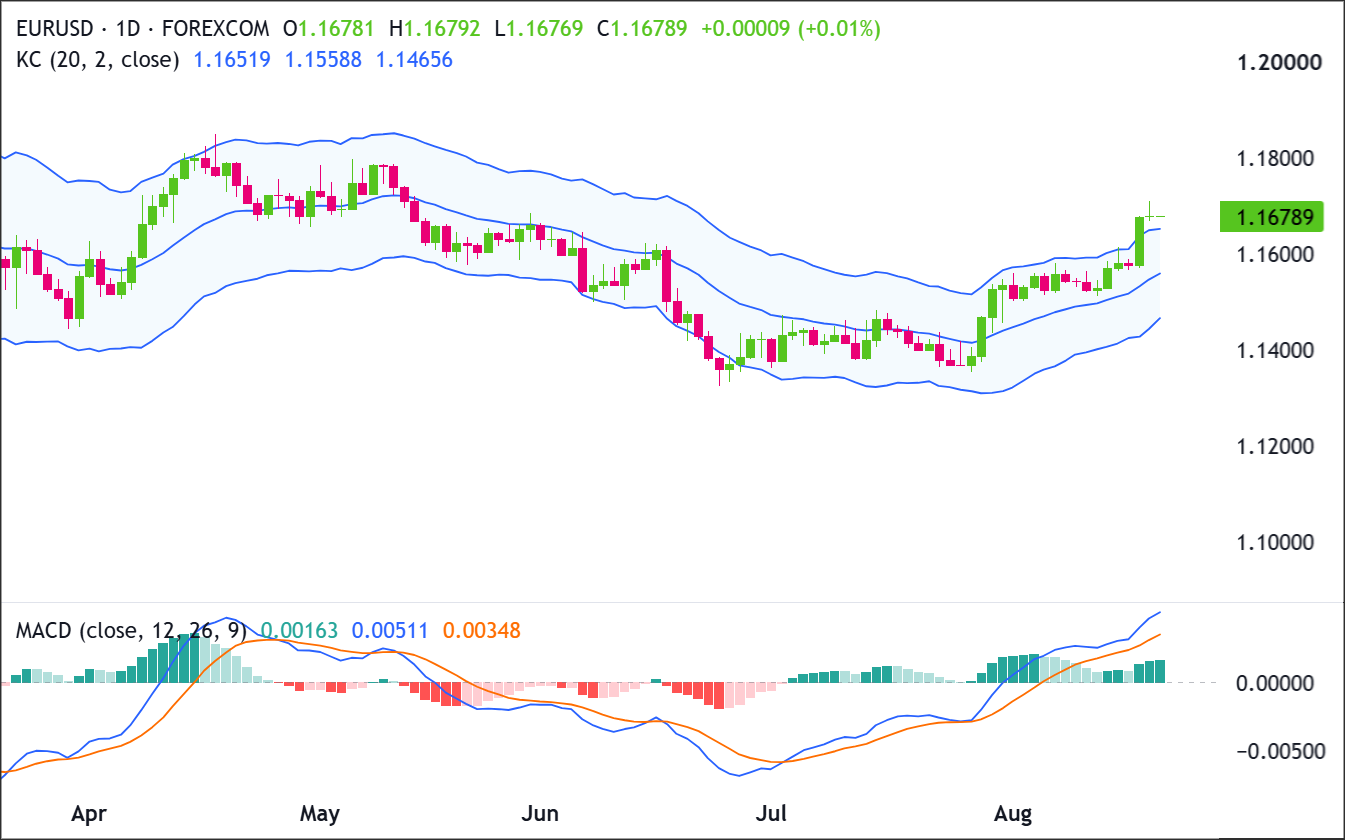
EUR/USD closed above the upper Keltner Channel.
This represents a volatility “stretch” day, where price has moved beyond what the recent average range would typically contain.
What This Signals
A close above the upper Keltner Channel can attract mean-reversion traders, because it indicates price is extended relative to its recent trend and volatility.
In that framing, the development suggests that upside may be temporarily “stretched,” and a pause, pullback, or consolidation becomes a common follow-on if the move is not sustained.
However, this same pattern can also represent momentum acceptance, where price “walks the band” and continues higher as volatility expands.In that case, what looks extended can persist for multiple sessions, especially if pullbacks remain shallow and closes hold above the Keltner middle line (often used as a trend filter).
Alternatively, the most challenging outcome is a bull-trap style spike: price briefly closes above the upper band, then quickly returns inside the channel and back below nearby breakout levels.
That sequence sometimes coincides with stop-runs near obvious highs (here, the 1.166–1.168 area), followed by a fast retracement toward the mid-channel or prior support.
The outcome depends heavily on follow-through versus rejection in the next few daily candles, the behavior around 1.166–1.168, and whether volatility expansion is accompanied by sustained directional structure (higher highs/higher lows) or immediate reversal pressure.
How It Works
The Keltner Channel is a volatility-based envelope built around an average price (typically an EMA).
The upper and lower bands are set a multiple of a volatility measure (commonly ATR) away from the middle line.
When price closes outside the channel, it signals that the move is larger than what recent volatility would usually imply.Because the channel adapts to volatility, it is often used to gauge whether price is trending strongly (frequent closes near/above the upper band in an uptrend) or overextended (a sudden tag/close outside the band after a run).
Important: A single close above the upper band is not a standalone reversal trigger. Keltner “breaches” can be noisy during trend shifts, and false signals are more common when markets transition from range to trend (or when news-driven volatility temporarily expands).
What to Look For Before Acting
Do not assume a reversal lower is imminent. Consider these factors:
✅ Whether EUR/USD holds above 1.1637 (the breached upper band) or quickly falls back inside the channel
✅ Signs of rejection (upper wicks, bearish follow-through candle, or a close back below 1.166–1.168)
✅ Whether price mean-reverts toward the Keltner middle line (~1.1532) in an orderly way (pullback) or sharply (failed breakout)
✅ Nearby support zones from recent structure: 1.157–1.158 (recent closes) and 1.150–1.153 (mid-channel region)
✅ If momentum remains persistent (multiple closes near the upper band), which can signal a band-walk rather than exhaustion
✅ Confirmation from a higher timeframe (Weekly): alignment or conflict with the broader trend and key weekly levels
✅ Event risk: upcoming ECB/Fed communication, inflation prints, and labor data that can sustain or fade volatility expansion
Risk Considerations
⚠️ Trend continuation risk: selling an upper-band breach can be costly if EUR/USD starts “walking the band” higher
⚠️ Whipsaw risk: price may dip back inside the channel briefly and then re-break higher
⚠️ Volatility expansion: wider daily ranges can increase slippage and make tight stops vulnerable
⚠️ Level crowding near highs: the 1.166–1.168 zone can attract stop-runs in both directions
Potential Next Steps
Keep EUR/USD on a watchlist as the pair tests whether its latest breakout can hold after closing above the upper Keltner Channel.
With MACD momentum still positive, sustained strength above 1.1650 would keep the near-term bullish structure intact, while a break back below 1.1600 would increase the risk of a deeper pullback.
EUR/USD has extended its recovery into the 1.1660–1.1680 area, with the latest closed daily candle finishing near its highs and reflecting firm buying pressure.
The next few sessions should show whether buyers can build on this advance and push toward the prior highs or whether momentum begins to fade after the recent surge.
Technical Analysis
EUR/USD has strengthened sharply from its late-July low and is now extending a sequence of higher highs and higher lows.
The most recent closed daily candle finished above the Keltner Channel’s upper boundary near 1.1652, showing unusually strong upside momentum.
MACD also supports the advance: the MACD line remains above the signal line, both are above zero, and the positive histogram has expanded. Immediate resistance is around 1.1680–1.1700, followed by the prior swing-high region around 1.1780–1.1800.
Buyers now need price to hold above roughly 1.1600–1.1650 and establish acceptance above 1.1680–1.1700.
A quick reversal beneath 1.1600 would suggest the breakout is losing momentum and could open the door to a deeper pullback toward 1.1550–1.1560.
New: Currency Converter
Quickly convert between currencies and check exchange rates with our new Currency Converter tool.
Trade Idea: Bullish Continuation Scenario
Setup
The bullish setup depends on the Keltner Channel breakout developing into sustained upside follow-through.
Price has already closed above the upper channel near 1.1652, while MACD remains firmly bullish.
Holding the 1.1600–1.1650 breakout area would keep buyers in control, but a daily close above 1.1700 would provide stronger confirmation that EUR/USD is ready to challenge the earlier highs around 1.1780–1.1800.
Entry
Consider entering long on a daily close above 1.1700, confirming that buyers are breaking out of the recent structure.
Alternatively, enter on a controlled pullback into 1.1600–1.1650 if price stabilizes there and turns back higher.
If price loses that support zone and closes decisively below 1.1550, stand aside and wait for either deeper support to form or a cleaner breakout later.
Stop Loss
For breakout entries: stop on a daily close back below 1.1650. That would invalidate the breakout by showing price could not stay above the former ceiling.
For pullback entries: stop on a daily close below 1.1550. That would invalidate the support-hold idea and show buyers are no longer defending the zone.
Take Profit
Target 1.1780–1.1800, because that is the next clear upside area on the chart and the most natural place for price to retest if the current recovery continues.
Bottom Line
The bullish case remains strongest while EUR/USD holds above 1.1600–1.1650, particularly after the latest closed candle breached the upper Keltner Channel near 1.1652 and MACD continued to strengthen.
A daily close above 1.1700 would reinforce the breakout.
That would put 1.1780–1.1800 in focus as the next upside target. A decisive close below 1.1550 would invalidate the continuation setup and suggest the breakout has failed.
Trade Idea: Bearish Pullback Scenario
Setup
The bearish scenario requires the latest Keltner Channel breach to lose follow-through.
The first area where buyers could stall is 1.1680–1.1700.
If price rejects that zone and subsequently loses 1.1600, the move above the upper channel could develop into a short-term exhaustion signal despite the currently bullish MACD configuration.
Entry
Consider entering short on a daily close below 1.1600, confirming that the support zone has failed.
Alternatively, if price pushes into 1.1680–1.1700 and prints a clear bearish rejection candle, enter short on the next daily close back below 1.1650.
If price instead breaks and closes decisively above 1.1700, stand aside, as that would invalidate the bearish pullback idea.
Stop Loss
For breakdown entries: stop on a daily close back above 1.1650. That would invalidate the breakdown by showing price has reclaimed the support zone.
For rejection entries near resistance: stop on a daily close above 1.1700. That would invalidate the bearish idea by confirming buyers have pushed through resistance.
Take Profit
Target 1.1550–1.1560, because that is the next major support area below the current structure, aligns closely with the Keltner Channel midline near 1.1559, and is the most likely place where buyers would try to step back in.
Bottom Line
The bearish case depends on EUR/USD failing to sustain its breakout around 1.1680–1.1700 and then losing 1.1600.
With MACD currently bullish, sellers would need clear price-action confirmation rather than simply assuming the upper-channel breach will reverse.
A confirmed breakdown below 1.1600 would bring 1.1550–1.1560 into focus. A decisive close above 1.1700 would invalidate the bearish pullback scenario and favor continued upside.
This content is strictly for informational purposes only and does not constitute as investment advice. Trading any financial market involves risk. Please read our Risk Disclosure to make sure you understand the risks involved.



