





EUR/USD is showing early signs of fatigue after its sharp late-July advance.
The pair has pulled back from recent highs near 1.1550, bringing support at 1.1500 into focus and raising the possibility of consolidation or a deeper retracement.
The key question now is whether sellers can build on the latest weakness or
whether buyers will step back in and revive the broader uptrend.
Welcome to “TA Alert of the Day.” Each day after the market close, MarketMilk scans for popular technical indicator alerts. We use these alerts as the basis for a mini-lesson, breaking down what each alert means, why it matters, and how traders might interpret it. The goal is to help beginner traders not only spot these alerts but also understand the logic behind them and how they can inform trading decisions.
What MarketMilk Has Detected
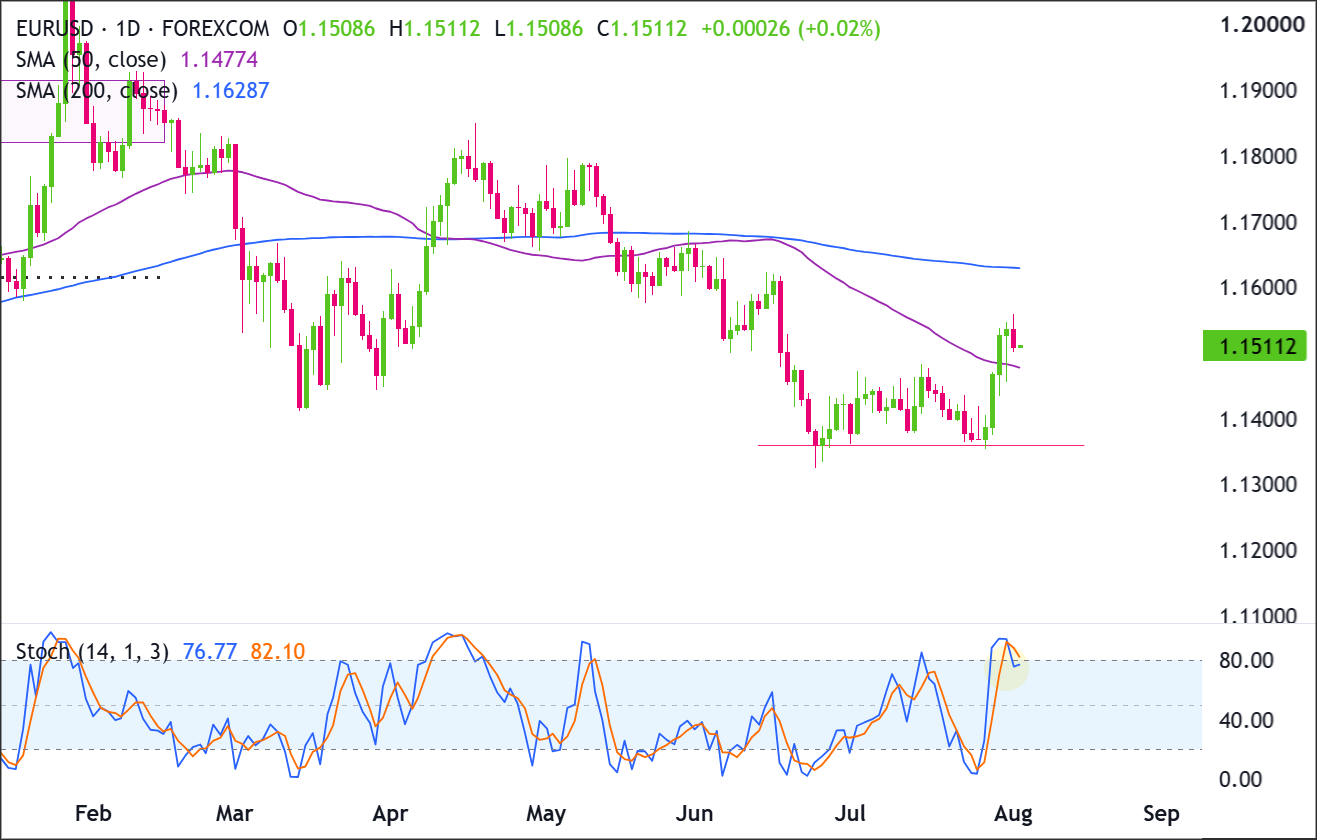
On the daily timeframe, Stochastic %K has crossed below %D while both lines remain above 80.
This combination is typically read as a momentum “rollover” occurring in overbought momentum territory.
What This Signals
Traditionally, a bearish Stochastic crossover above 80 suggests that upside momentum is cooling after an extended push, and it can attract mean-reversion traders who look for pullbacks toward prior support.
If the move is sustained, this type of rollover often marks a transition from acceleration into consolidation or a deeper retracement.
However, this same pattern can also represent nothing more than a brief pause within a strong uptrend. In trending markets,Stochastic can remain elevated for multiple sessions, and bearish crossovers can “reset” quickly if price stabilizes and pushes back toward the highs, creating whipsaws for traders who treat the first cross as a standalone reversal trigger.
The outcome depends heavily on follow-through price action, nearby support/resistance behavior, and whether the broader trend structure remains intact.
Context and confirmation are essential, especially when the oscillator is signaling from an overbought region where both continuation and pullback scenarios are common.
How It Works
The Stochastic oscillator compares the latest close to the recent high-low range over a lookback period (here 14).
The %K line is the faster component, while %D is a smoothed signal line (here 3, 3).
A bearish crossover occurs when %K falls below %D, indicating that recent closes are losing strength relative to the prior range.
Readings above 80 are commonly described as overbought momentum, meaning price has been closing near the top of its recent range.
Important: Stochastic signals are more reliable when they align with clear resistance levels, a broader trend shift, or additional evidence (such as a break of a prior swing low). In strong trends, crossovers can occur repeatedly without producing a meaningful reversal.
What to Look For Before Acting
Do not assume an immediate downside reversal. Consider these factors:
✅ Whether EUR/USD holds above the former breakout area around 1.1460–1.1473 (recent swing and prior ceiling zone)
✅ A daily close below 1.1500 followed by additional downside follow-through (reduces “one-candle” signal risk)
✅ Any break below the most recent higher low structure from the late-July surge (trend structure confirmation)
✅ How price reacts if it revisits 1.1420–1.1430 (multiple historical closes clustered in this region)
✅ Signs of rejection near 1.1550–1.1560 if price retests the highs (helps confirm resistance is respected)
✅ Whether Stochastic continues to unwind (e.g., moving out of the 80+ zone) rather than re-crossing higher immediately
✅ Alignment with the Weekly structure (avoid relying only on the daily signal)
✅ Upcoming macro catalysts that can override technicals (ECB/Fed communication, inflation and labor data, risk sentiment shifts)
Risk Considerations
⚠️ Whipsaw risk: bearish Stochastic crosses above 80 can flip back quickly if the uptrend remains strong
⚠️ Trend persistence: overbought momentum can stay elevated for extended periods in directional markets
⚠️ False reversal risk: a modest pullback can trigger the crossover without breaking any meaningful support
⚠️ Event-driven risk: EUR/USD can reprice sharply around major economic releases, reducing the usefulness of oscillator timing
Potential Next Steps
Consider placing EUR/USD on a watchlist as the pair tests nearby resistance after a strong rebound, with buyers seeking a continuation breakout while a bearish Stochastic crossover warns that upward momentum may be starting to fade.
EUR/USD remains in a broader bearish structure below the 200-day SMA at 1.1629, but the rebound from 1.1360–1.1380 has reclaimed the 50-day SMA at 1.1477 and improved the short-term picture.
Price is approaching resistance at 1.1545–1.1560, with the next major ceiling around 1.1625–1.1640
Buyers repeatedly defended 1.1360–1.1380 before producing an impulsive rebound through 1.1475–1.1490.
Recent candles show the advance losing momentum after testing 1.1545–1.1560, with rejection near the highs and smaller candle bodies.
Buyers need a daily close above 1.1550 to extend the recovery, while sellers need to push price below 1.1475 to confirm that the rebound is failing.
Trade Idea: Bullish Continuation Scenario
Setup
The bullish setup depends on EUR/USD holding the reclaimed 1.1475–1.1490 area and converting it into support.
A daily close above 1.1550 would break the immediate swing-high structure and create room for price to approach the 200-day SMA and prior resistance around 1.1625–1.1640.
Because Stochastic has crossed lower from overbought territory, buyers need clear price confirmation rather than relying on the recent momentum alone.
Entry
Consider entering long on a daily close above 1.1550, confirming that buyers are breaking out of the recent structure.
Alternatively, enter on a controlled pullback into 1.1475–1.1490 if price stabilizes there, Stochastic stops falling, and price turns back higher.
If price loses that support zone and closes decisively below 1.1460, stand aside and wait for either deeper support to form or a cleaner breakout later.
Stop Loss
For breakout entries: stop on a daily close back below 1.1510. That would invalidate the breakout by showing price could not stay above the former ceiling.
For pullback entries: stop on a daily close below 1.1460. That would invalidate the support-hold idea and show buyers are no longer defending the zone.
Take Profit
Target 1.1625–1.1640, because that is the next clear upside area on the chart and the most natural place for price to retest if the current recovery continues.
Bottom Line
The bullish case strengthens on a daily close above 1.1550, which would confirm that buyers have cleared the latest swing high and could extend the rebound toward 1.1625–1.1640. A renewed Stochastic turn higher would add momentum confirmation.
The setup remains constructive while EUR/USD holds 1.1475–1.1490. A decisive close below 1.1460 would invalidate the near-term bullish structure, particularly while Stochastic momentum is weakening.
This EUR/USD setup leans on breakout and pullback entries around key structure levels, concepts that go deeper than a single trade idea. Premium members can read our lesson:
📖 Price Action Setups: The Big Three
Reading this helps you understand how to validate a breakout entry, how pullback entries differ from breakout entries, and where stop placement fits each setup type.
And if you’re not a Premium subscriber yet, now’s a good time to sign up.
With Babypips Premium, you get full access to School of Pipsology lessons that help you understand not just where a level sits on the chart, but which price action setup a level like this actually calls for and how to manage the trade around it.
Trade Idea: Bearish Pullback Scenario
Setup
The bearish setup focuses on a failure beneath 1.1545–1.1560 after the sharp rebound.
The Stochastic bearish crossover near overbought territory supports the possibility that buying momentum is becoming exhausted.
Sellers would gain stronger confirmation if price loses the reclaimed support and 50-day SMA area around 1.1475–1.1490, opening the way back toward 1.1360–1.1380.
Entry
Consider entering short on a daily close below 1.1475, confirming that the support zone has failed.
Alternatively, if price pushes into 1.1545–1.1560 and prints a clear bearish rejection candle while Stochastic continues lower, enter short on the next daily close back below 1.1510.
If price instead breaks and closes decisively above 1.1560, stand aside, as that would invalidate the bearish pullback idea.
Stop Loss
For breakdown entries: stop on a daily close back above 1.1500. That would invalidate the breakdown by showing price has reclaimed the support zone.
For rejection entries near resistance: stop on a daily close above 1.1560. That would invalidate the bearish idea by confirming buyers have pushed through resistance.
Take Profit
Target 1.1360–1.1380, because that is the next major support area below the current structure and the most likely place where buyers would try to step back in.
Bottom Line
The bearish case is supported by the Stochastic crossover lower and depends on EUR/USD failing at 1.1545–1.1560 before closing below 1.1475.
That combination would indicate that the rebound has lost momentum and shift focus toward 1.1360–1.1380.
A decisive daily close above 1.1560 would invalidate the rejection setup and suggest that buyers have overcome both resistance and the current momentum warning.
This content is strictly for informational purposes only and does not constitute as investment advice. Trading any financial market involves risk. Please read our Risk Disclosure to make sure you understand the risks involved.



