


EUR/USD has extended its decline below the 1.14 handle, with selling pressure beginning to look stretched after several sessions of losses.
The move has pushed the price into an important zone where sellers may try to maintain control, but buyers may also start looking for signs of stabilization.
For now, the key question is whether EUR/USD can reclaim nearby support, or whether any short-term bounce simply fades into another leg lower.
Welcome to “TA Alert of the Day.” Each day after the market close, MarketMilk scans for popular technical indicator alerts. We use these alerts as the basis for a mini-lesson, breaking down what each alert means, why it matters, and how traders might interpret it. The goal is to help beginner traders not only spot these alerts but also understand the logic behind them and how they can inform trading decisions.
What MarketMilk Has Detected
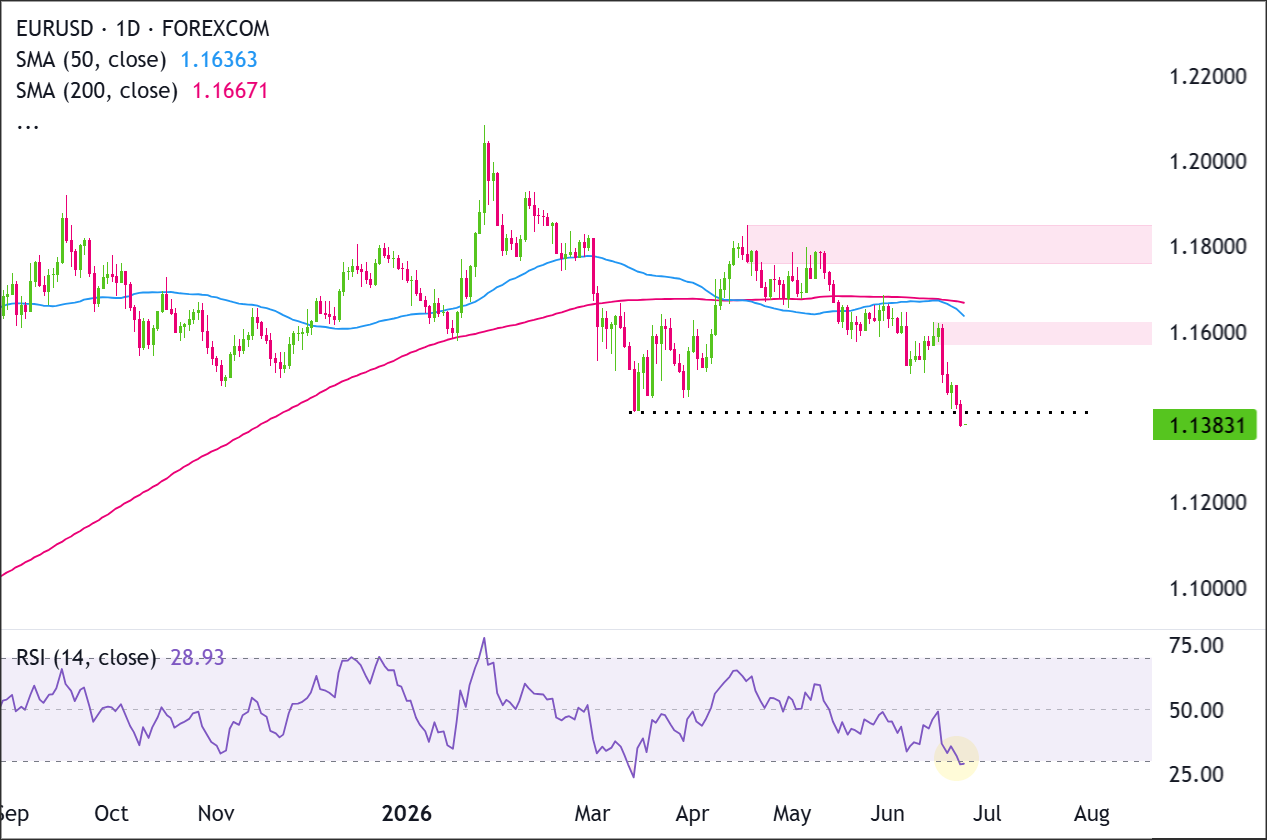
MarketMilk detected RSI(14) falling to 28.25, crossing below the classic 30 oversold threshold on the daily timeframe.
Price closed at 1.138145 after trading as low as 1.137565, extending a downswing that has been building since May.
Since last week, EUR/USD has dropped from the 1.1620 area toward the 1.14 handle, reflecting a clear intensification in bearish momentum.
What This Signals
Traditionally, an RSI(14) move below 30 suggests that selling pressure has become unusually strong relative to recent history.
This type of oversold momentum can attract dip-buyers and short-covering, and it often marks areas where price begins to stabilize if the move is sustained back above key short-term levels.
However, this same pattern can also represent trend persistence rather than exhaustion. In sustained downswings,
RSI can remain oversold or repeatedly dip below 30 while price continues to grind lower, creating “early” reversal signals.In that scenario, any rebound attempt that fails quickly can become a setup for continuation selling, especially if prior support zones start acting like resistance.
Alternatively, oversold conditions near well-defined support can develop into a bear-trap style flush, where prices briefly pierce support (or set marginal new lows) and then snap back once sell orders are absorbed.
That outcome is often accompanied by improved price action (e.g., a strong close off the lows) and follow-through in subsequent sessions.
The outcome depends heavily on follow-through price action, where the close prints relative to nearby support/resistance, and whether momentum improves (RSI reclaiming 30–40) while volatility remains controlled.
Context and confirmation are essential, especially after a sharp multi-day slide.
How It Works
The Relative Strength Index (RSI) is a momentum oscillator that compares the magnitude of recent gains to recent losses over a set period (here, 14 bars).
RSI ranges from 0 to 100. Readings below 30 are commonly considered “oversold,” while readings above 70 are commonly considered “overbought.”
However, because RSI measures momentum, an oversold reading does not mean price has to reverse.
It simply means recent selling pressure has been strong enough to push momentum into an extreme zone. Traders often use this signal to watch for signs of stabilization, a possible reversal setup, or at least a slowdown in downside momentum.
Important: RSI extremes tend to work best when combined with structure (clear support/resistance) and confirmation (a reversal candle, a break of a minor downtrend line, or RSI reclaiming key thresholds). In strong trends, RSI can stay oversold longer than many expect, which is why timing solely from the first oversold print can be risky.
What to Look For Before Acting
Do not assume an immediate rebound. Consider these factors:
✅ A daily close back above 1.1418–1.1458 (recent pivot area) to suggest demand is defending the breakdown zone
✅ RSI(14) reclaiming 30 and then 40, which often signals momentum is normalizing rather than staying extreme
✅ A clear reversal-style candle (strong close off the lows) or a short series of higher lows on the daily chart
✅ Whether 1.1500–1.1525 flips back into resistance (bearish) or is reclaimed (constructive)
✅ Signs of seller exhaustion (smaller real bodies, reduced downside follow-through after fresh lows)
✅ Alignment with the 4-Hour or Weekly structure (e.g., is price bouncing from a larger timeframe support zone?)
✅ Nearby event risk: upcoming ECB/Fed communication, inflation, or labor data that could drive a momentum continuation regardless of RSI
Risk Considerations
⚠️ Oversold can persist: RSI can remain below 30 during strong downtrends, producing repeated early reversal signals
⚠️ False bounce risk: initial rebounds from oversold conditions sometimes fail at the first overhead resistance (often prior support)
⚠️ Event risk: macro headlines can overwhelm technical extremes on FX pairs, especially around major releases
⚠️ Support breaks can accelerate: a decisive loss of the 1.1375–1.1420 zone could shift focus to deeper downside levels.
Potential Next Steps
Add EUR/USD to a watchlist for evidence of stabilization near the 1.14 area and track whether RSI can recover back above 30.
Recent candles show a sharp bearish expansion lower after price failed to hold the 1.1600 area.
Sellers have pushed EUR/USD through the prior floor near 1.1400-1.1450, while RSI has dropped into oversold territory, showing stretched downside momentum.
Buyers need to reclaim 1.1450 and see RSI turn back above the oversold zone to support a recovery attempt, while sellers need price to stay below 1.1400-1.1450 and continue pressing toward 1.1200.
Trade Idea: Bullish Continuation Scenario
Setup
The bullish setup is a counter-trend recovery scenario rather than a clean continuation setup. EUR/USD is oversold on RSI, so a relief bounce is possible, but the setup only improves if price quickly reclaims the broken support zone around 1.1400-1.1450.
A daily close above 1.1450, ideally with RSI turning back above 30, would suggest selling momentum is easing and could open the door for a recovery toward the overhead resistance cluster at 1.1600-1.1667.
Entry
Consider entering long on a daily close above 1.1450, confirming that buyers are breaking out of the recent structure.
Alternatively, enter on a controlled pullback into 1.1380-1.1400 if price stabilizes there, RSI starts to turn higher from oversold conditions, and price turns back higher.
If price loses that support zone and closes decisively below 1.1350, stand aside and wait for either deeper support to form or a cleaner breakout later.
Stop Loss
For breakout entries: stop on a daily close back below 1.1400. That would invalidate the breakout by showing price could not stay above the former ceiling.
For pullback entries: stop on a daily close below 1.1350. That would invalidate the support-hold idea and show buyers are no longer defending the zone.
Take Profit
Target 1.1600-1.1667, because that is the next clear upside area on the chart and the most natural place for price to retest if the current recovery continues.
Bottom Line
The bullish case needs EUR/USD to reclaim 1.1450 quickly, with RSI turning higher from oversold conditions.
A daily close above 1.1450 would suggest the recent break below 1.1400-1.1450 may be losing downside momentum and could support a recovery toward 1.1600-1.1667.
The setup weakens if price closes below 1.1350. That would show buyers failed to defend the current low area and would leave EUR/USD vulnerable to another leg lower.
Trade Idea: Bearish Pullback Scenario
Setup
The bearish setup remains active while EUR/USD stays below the broken support zone at 1.1400-1.1450.
RSI is oversold, so sellers should be aware of potential short-term bounce risk, but the broader pressure remains bearish unless price reclaims 1.1450.
If price fails into 1.1400-1.1450 or breaks lower from current levels, sellers would remain in control and could target the next major downside zone near 1.1300.
Entry
Consider entering short on a daily close below 1.1350, confirming that the support zone has failed.
Alternatively, if price pushes into 1.1400-1.1450 and prints a clear bearish rejection candle, enter short on the next daily close back below 1.1400.
If price instead breaks and closes decisively above 1.1450, stand aside, as that would invalidate the bearish pullback idea.
Stop Loss
For breakdown entries: stop on a daily close back above 1.1400. That would invalidate the breakdown by showing price has reclaimed the support zone.
For rejection entries near resistance: stop on a daily close above 1.1450. That would invalidate the bearish idea by confirming buyers have pushed through resistance.
Take Profit
Target 1.1200, because that is the next major support area below the current structure and the most likely place where buyers would try to step back in.
Bottom Line
The bearish case stays favored while EUR/USD remains below 1.1400-1.1450. A rejection from that former support zone, followed by a close back below 1.1400, would keep sellers in control and support a move toward 1.1200.
A daily close above 1.1450 would weaken the bearish setup, especially if RSI also turns higher from oversold conditions. That would show buyers have reclaimed the breakdown zone and could shift focus back toward 1.1600-1.1667.
This content is strictly for informational purposes only and does not constitute as investment advice. Trading any financial market involves risk. Please read our Risk Disclosure to make sure you understand the risks involved.


