





EUR/USD is pushing into a key decision zone after a steady run higher, with price now testing an area where bullish momentum could either extend or begin to fade.
The pair remains close to recent highs, but the next few sessions could reveal whether buyers still have enough strength to force a breakout or whether sellers are starting to take control.
Welcome to “TA Alert of the Day.” Each day after the market close, MarketMilk scans for popular technical indicator alerts. We use these alerts as the basis for a mini-lesson, breaking down what each alert means, why it matters, and how traders might interpret it. The goal is to help beginner traders not only spot these alerts but also understand the logic behind them and how they can inform trading decisions.
What MarketMilk Has Detected
RSI on the daily timeframe has crossed into overbought momentum, rising to 70.51 and moving above the 70.00 threshold.
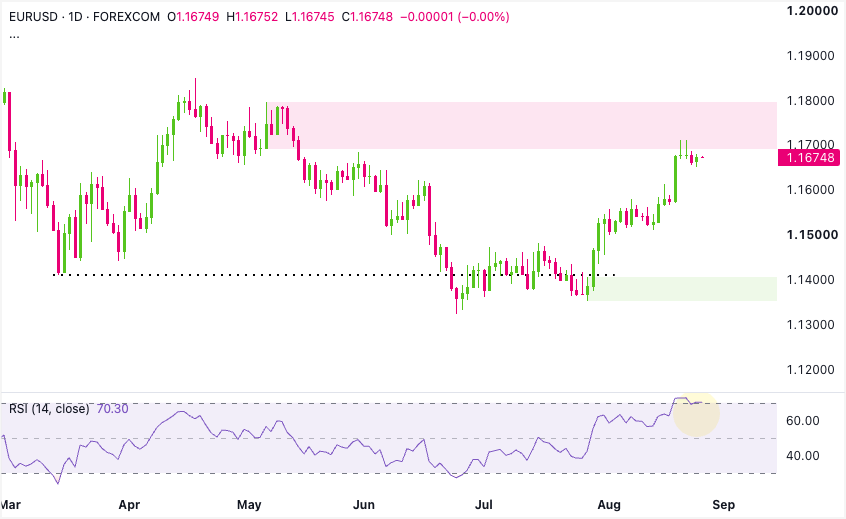
What This Signals
An RSI move above 70 suggests that upside momentum is stretched relative to recent price action.
This condition can attract profit-taking and mean-reversion traders, especially if price begins to stall beneath a clear resistance zone (here, the 1.1710 area).
If the move is sustained, traders often watch for RSI to roll over from overbought while price struggles to make fresh highs.
However, this same pattern can also represent trend strength rather than exhaustion.In persistent uptrends, RSI can remain above 70 for extended periods while price continues grinding higher, and the “overbought” condition sometimes coincides with breakout acceptance.
Particularly if EUR/USD can hold above the recent breakout region from late July (around 1.1466–1.1528) and keep printing higher lows.
Alternatively, the market can deliver a quick bull trap: price briefly pokes toward/through the recent highs near 1.1710, but RSI fails to expand and then slips back below 70 as sellers fade the move.
That sequence often produces a fast pullback toward nearby support, especially if daily closes start occurring back under 1.1660–1.1650.
The outcome depends heavily on follow-through in price action, the broader trend structure (higher highs/higher lows vs. distribution), and where RSI goes next (stays elevated vs. breaks down).
How It Works
The Relative Strength Index (RSI) is a momentum oscillator that measures the speed and magnitude of recent gains versus losses, typically over 14 periods.
Values range from 0 to 100, with 70+ commonly treated as overbought momentum and 30- as oversold momentum.
When RSI rises above 70, it means recent price gains have been much stronger than losses, pushing momentum into overbought territory.
Important: Overbought readings can persist in strong trends, and the most useful information often comes from how RSI behaves after reaching 70 (e.g., quick rejection back below 70 vs. sustained readings above 70 with rising price). Single-indicator signals are generally less reliable without structure and level confirmation.
What to Look For Before Acting
Don’t assume a bearish reversal. Consider these factors:
✓ Whether EUR/USD fails to close near the recent highs (1.1710–1.1712) and starts posting lower daily closes
✓ RSI behavior: a drop back below 70 and continued deterioration toward the midline (50) vs. holding elevated
✓ Signs of bearish divergence (price tests the highs while RSI prints a lower high) on upcoming swings
✓ Reaction at nearby support around 1.1650; whether dips get bought quickly or start to “stick”
✓ Structure check: does price maintain higher lows above the mid-August basing areas (~1.1525–1.1580)
✓ Higher-timeframe alignment on the Weekly chart (trend direction and where price sits versus multi-week resistance)
✓ Volatility/impulse: whether pullbacks are orderly (consolidation) or sharp (distribution)
✓ Event risk: upcoming ECB/Fed communication, inflation, and labor-market data that can quickly override oscillator signals
Risk Considerations
⚠️ Trend persistence risk: RSI can stay overbought while EUR/USD continues higher, creating premature short entries
⚠️ Whipsaw risk: quick dips below 70 can reverse back up if buyers defend the trend
⚠️ Level risk near highs: fading strength into 1.1710 can be costly if a breakout accelerates
⚠️ Macro headline risk: FX can reprice abruptly around central bank and data surprises
Potential Next Steps
Add EUR/USD to a watchlist as it tests a major supply area with RSI in overbought territory.
The next confirmed break or rejection could define the near-term direction.
Technical Analysis
EUR/USD is recovering through a sequence of higher lows.
Strong bullish candles carried price into supply, but RSI at 70.30 signals overbought conditions.
Buyers must close above 1.1800 to confirm continuation; sellers need a rejection and loss of 1.1600.
Trade Idea: Bullish Continuation Scenario
Setup
A daily close above 1.1800 would clear the pink supply zone and confirm that buyers remain in control. On a pullback, 1.1600–1.1620 must hold to preserve the rising structure.
Entry
Consider entering long on a daily close above 1.1800, confirming a breakout from the recent structure.
Alternatively, enter on a controlled pullback into 1.1600–1.1620 if price stabilizes and turns higher.
If price closes decisively below 1.1580, stand aside and wait for deeper support or a new breakout structure.
Stop Loss
For breakout entries: stop on a daily close back below 1.1700, indicating that price has fallen back inside supply.
For pullback entries: stop on a daily close below 1.1580, confirming that nearby support has failed.
Take Profit
Target 1.1900, the next visible upside area above the supply zone.
Bottom Line
Bullish confirmation requires a daily close above 1.1800, with 1.1900 as the next target.
A close below 1.1580 invalidates the immediate continuation setup.
Trade Idea: Bearish Pullback Scenario
Setup
Overbought RSI conditions increase the possibility of rejection from the pink supply zone at 1.1690–1.1800. A break below 1.1600 would confirm that sellers have gained control.
Entry
Consider entering short on a daily close below 1.1600, confirming that support has failed.
Alternatively, if price prints a bearish rejection within 1.1690–1.1800, enter short on the next daily close below 1.1660.
If price closes decisively above 1.1800, stand aside because supply has been broken.
Stop Loss
For breakdown entries: stop on a daily close back above 1.1620, showing that price has reclaimed support.
For rejection entries: stop on a daily close above 1.1800, confirming that buyers have pushed through resistance.
Take Profit
Target 1.1350–1.1400, where the green demand zone could attract renewed buying.
Bottom Line
A rejection from 1.1690–1.1800 followed by a break below 1.1600 would expose 1.1350–1.1400.
A daily close above 1.1800 invalidates the bearish pullback scenario.
This content is strictly for informational purposes only and does not constitute as investment advice. Trading any financial market involves risk. Please read our Risk Disclosure to make sure you understand the risks involved.



