


EUR/USD has started to show early signs of improving momentum after a choppy stretch in recent weeks.
A widely followed trend-momentum gauge has just flipped in a way that often gets swing traders’ attention.
With price still trading below prior peaks, this development is less about a “breakout” and more about whether buying pressure can persist.
The next few sessions may show whether this is the start of a stronger move higher or just another short-lived bounce inside the range.
Welcome to “TA Alert of the Day.” Each day after the market close, MarketMilk scans for popular technical indicator alerts. We use these alerts as the basis for a mini-lesson, breaking down what each alert means, why it matters, and how traders might interpret it. The goal is to help beginner traders not only spot these alerts but also understand the logic behind them and how they can inform trading decisions.
What MarketMilk Has Detected
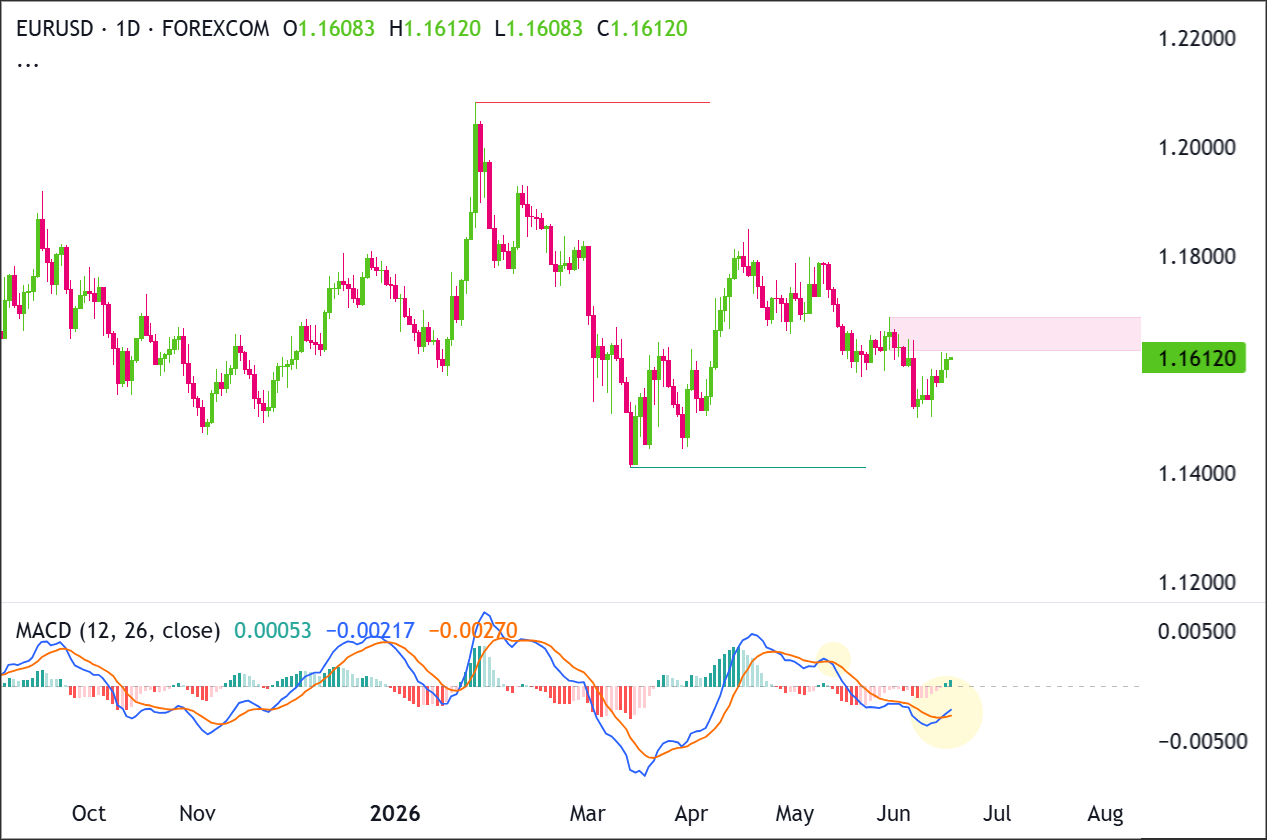
On the daily chart, MACD(12,26,9) has crossed above its Signal line, meeting the bullish crossover condition.
This crossover is occurring after EUR/USD rebounded from early-June weakness, where price dipped to the 1.1500 zone before recovering toward 1.1600.
Price has previously struggled to sustain moves above the 1.172–1.176 region (late April and early May) and reached a higher peak near 1.1849 (mid-April), making those areas notable reference points if upside continues.
What This Signals
A bullish MACD crossover often marks a shift toward improving upside momentum, particularly when it follows a pullback and coincides with price holding above nearby support.
If the move is sustained, it can attract trend-following interest as it suggests the recent downswing is losing traction and upward momentum is rebuilding.
However, this same pattern can also represent a counter-trend bounce rather than a durable turn, especially when the MACD remains below the zero line (as it does here).In that setup, crossovers sometimes coincide with short-lived rallies where prices briefly firm up, then roll over as overhead resistance reasserts itself.
Alternatively, the crossover may simply reflect mean reversion inside a broader consolidation. EUR/USD has spent much of May and June oscillating, and in ranging conditions MACD signals can whipsaw, flipping bullish and bearish without a clean follow-through.
The outcome depends heavily on follow-through in price action, the market’s proximity to resistance (notably 1.166–1.172), and whether volatility expands in the direction of the signal.
How It Works
MACD (Moving Average Convergence Divergence) compares two exponential moving averages (typically 12- and 26-period) to gauge momentum, then smooths that series with a 9-period average called the Signal line.
A bullish crossover occurs when the MACD line rises above the Signal line, indicating the shorter-term momentum is strengthening relative to the longer-term baseline.
The histogram (MACD minus Signal) turning positive supports the same idea: momentum is shifting upward versus the recent trend.
In this case, the histogram has moved above zero (from slightly negative to +0.000269), reinforcing that the crossover is active on this bar.
Important: MACD is a lagging indicator. It confirms momentum after it has already started to turn. Its reliability tends to improve when the crossover aligns with clear structure (breaks of resistance, higher highs/higher lows) and can degrade in sideways markets where frequent crossovers occur.
What to Look For Before Acting
Do not assume the signal implies a sustained uptrend. Consider these factors:
✅ Follow-through closes: additional daily closes holding above 1.1600 rather than fading back into the prior chop
✅ Structure shift: a push toward and through the 1.1660–1.1685 area (late-May highs) to confirm improving market structure
✅ Resistance reaction: how price behaves near 1.1720–1.1760, a repeated supply zone from late April/early May
✅ Support integrity: whether 1.1518–1.1534 (early-June lows) continues to hold on pullbacks
✅ MACD behavior after the cross: histogram staying positive and MACD continuing to rise (rather than quickly crossing back down)
✅ Trend confirmation on a higher timeframe: check the Weekly chart for alignment (avoid relying on the daily signal alone)
✅ Event risk awareness: upcoming ECB/Fed communication, inflation, and labor data can overwhelm indicator-based setups in EUR/USD
Risk Considerations
⚠️ Whipsaw risk: in range-bound conditions, MACD crossovers can fail quickly and flip back
⚠️ Overhead supply: multiple prior turning points between 1.166–1.176 can cap rallies and trigger pullbacks
⚠️ Zero-line headwind: with MACD still below zero, the signal can reflect a bounce rather than a full trend reversal
⚠️ Macro volatility: EUR/USD can reprice sharply around rate expectations, making technical levels less “sticky”
Potential Next Steps
Consider placing EUR/USD on a watchlist and tracking whether price can build above nearby resistance while keeping pullbacks shallow.
Recent candles show buyers stepping in after the pullback into 1.1510, but price is now approaching the lower edge of the 1.1630-1.1690 supply zone.
Buyers need a daily close above 1.1690 to confirm continuation, while sellers need a rejection from this zone followed by a breakdown below 1.1510 to regain control.
Trade Idea: Bullish Continuation Scenario
Setup
The bullish setup depends on EUR/USD holding above the recent recovery base around 1.1550-1.1510 and pushing through the resistance zone at 1.1630-1.1690.
A daily close above 1.1690 would show buyers are breaking the recent ceiling and opening the door for a move toward 1.1780-1.1810.
Entry
Consider entering long on a daily close above 1.1690, confirming that buyers are breaking out of the recent structure.
Alternatively, enter on a controlled pullback into 1.1550-1.1510 if price stabilizes there and turns back higher.
If price loses that support zone and closes decisively below 1.1510, stand aside and wait for either deeper support to form or a cleaner breakout later.
Stop Loss
For breakout entries: stop on a daily close back below 1.1630. That would invalidate the breakout by showing price could not stay above the former ceiling.
For pullback entries: stop on a daily close below 1.1510. That would invalidate the support-hold idea and show buyers are no longer defending the zone.
Take Profit
Target 1.1780-1.1810, because that is the next clear upside area on the chart and the most natural place for price to retest if the current recovery continues.
Bottom Line
The bullish case improves if EUR/USD closes above 1.1690 and confirms a breakout from the current resistance zone. That would shift focus toward 1.1780-1.1810 as the next upside target.
The setup weakens if price fails to hold above 1.1630 after a breakout or loses the pullback support zone near 1.1550-1.1510. A daily close below 1.1510 would invalidate the bullish continuation idea.
Trade Idea: Bearish Pullback Scenario
Setup
The bearish setup depends on EUR/USD failing inside the 1.1630-1.1690 resistance zone and rolling over from there.
Sellers would gain stronger control if price loses 1.1510, which would confirm that the recent recovery attempt has failed and expose the larger support area near 1.1410-1.1420.
Entry
Consider entering short on a daily close below 1.1510, confirming that the support zone has failed.
Alternatively, if price pushes into 1.1630-1.1690 and prints a clear bearish rejection candle, enter short on the next daily close back below 1.1630.
If price instead breaks and closes decisively above 1.1690, stand aside, as that would invalidate the bearish pullback idea.
Stop Loss
For breakdown entries: stop on a daily close back above 1.1550. That would invalidate the breakdown by showing price has reclaimed the support zone.
For rejection entries near resistance: stop on a daily close above 1.1690. That would invalidate the bearish idea by confirming buyers have pushed through resistance.
Take Profit
Target 1.1410-1.1420, because that is the next major support area below the current structure and the most likely place where buyers would try to step back in.
Bottom Line
The bearish case is strongest if EUR/USD rejects the 1.1630-1.1690 resistance zone and then closes below 1.1510. That would confirm sellers have defended resistance and broken the recent recovery structure.
A breakdown below 1.1510 would put 1.1410-1.1420 back in focus. The bearish idea is invalidated if price closes decisively above 1.1690.
This content is strictly for informational purposes only and does not constitute as investment advice. Trading any financial market involves risk. Please read our Risk Disclosure to make sure you understand the risks involved.


