


EUR/USD is showing early signs of fading upside momentum.
Price is now trading below a clear resistance zone near the April highs.
Buyers have not lost control, but they have also failed to force a breakout. That leaves the pair in a holding pattern.
A push back into resistance could revive the upside case. Further rejection may instead point to a broader pullback after the recent recovery.
Welcome to “TA Alert of the Day.” Each day after the market close, MarketMilk scans for popular technical indicator alerts. We use these alerts as the basis for a mini-lesson, breaking down what each alert means, why it matters, and how traders might interpret it. The goal is to help beginner traders not only spot these alerts but also understand the logic behind them and how they can inform trading decisions.
What MarketMilk Has Detected
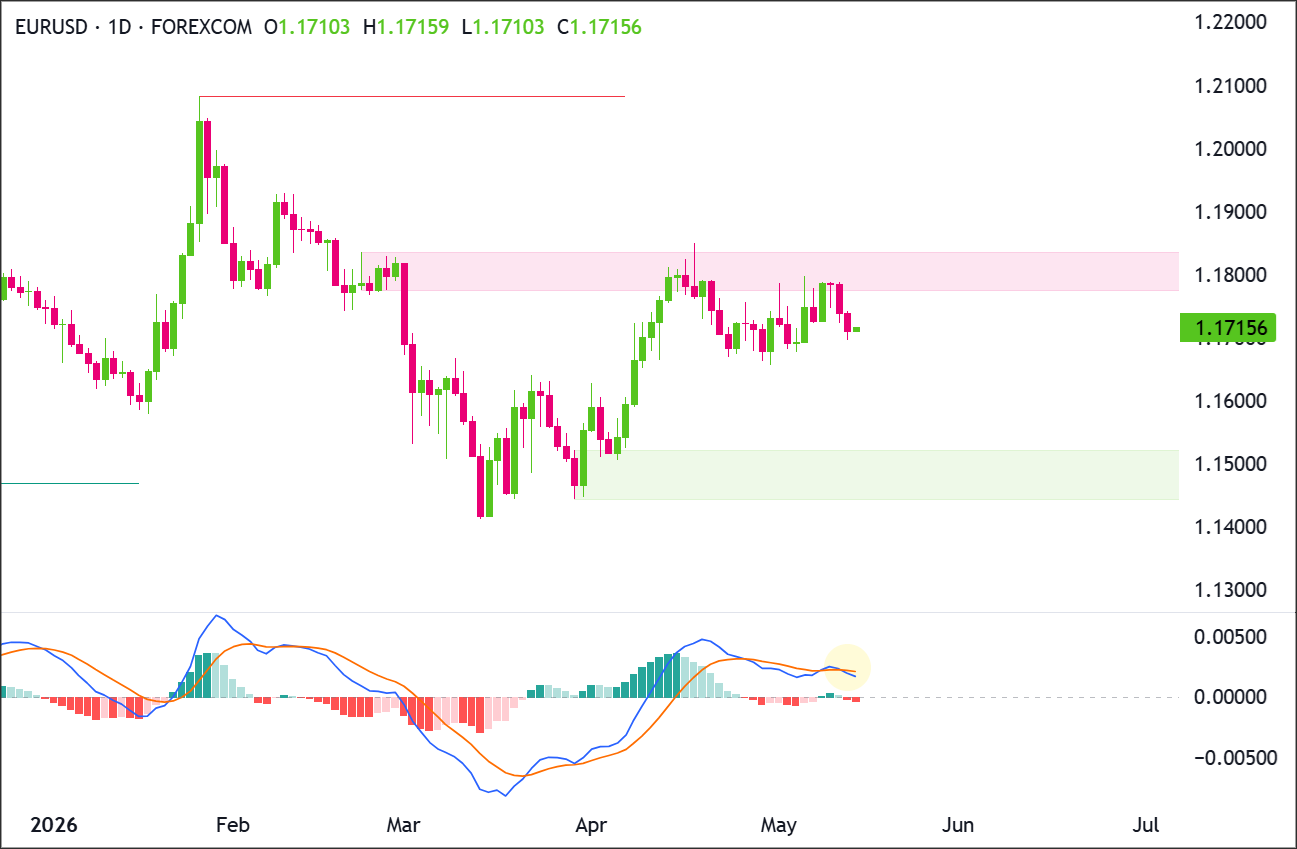
MarketMilk detected a bearish MACD(12,26,9) crossover on the daily chart, where the MACD line moved below its signal line.
This crossover occurred as EUR/USD eased to ~1.1715 after failing to hold the higher levels seen in mid-April.
What This Signals
A bearish MACD crossover often marks a shift from accelerating to decelerating upside momentum.
In practice, it can attract sellers or profit-taking interest, especially when it appears after a strong rebound (as seen from the March lows into April).
If the move is sustained, traders sometimes interpret it as a transition toward a broader pullback or consolidation phase.However, this same pattern can also represent a whipsaw during range-bound trade.
MACD crossovers can occur when price chops sideways, where prices briefly dip, trigger a bearish crossover, and then rebound, particularly if buyers defend nearby support around 1.168 and reclaim the 1.173–1.175 area.
Alternatively, the crossover may reflect a late confirmation of weakness already underway rather than a fresh turning point.
Since EUR/USD has already rotated lower from the mid-April highs near 1.182–1.185, some of the momentum shift may already be “priced in,” increasing the importance of whether price actually breaks key structure levels rather than simply oscillating.
The outcome depends heavily on trend context, proximity to support/resistance, and follow-through in price action over the next several sessions.
Context and confirmation are essential, particularly on the daily timeframe where MACD is slow-moving and can lag real-time turning points.
How It Works
The MACD (Moving Average Convergence Divergence) compares two exponential moving averages (typically 12- and 26-period EMAs) to measure momentum.
The signal line is usually a 9-period EMA of the MACD line.
A bearish crossover occurs when the MACD line crosses below the signal line, indicating that recent momentum is weakening relative to the prior trend.
Because MACD is built from moving averages, it is inherently a lagging indicator.
It tends to confirm shifts after price has already started rotating, which is why traders often combine it with structure (support/resistance), trend filters, and price-action confirmation.
Important: MACD crossovers can be less reliable in sideways markets and can trigger multiple false starts. Reliability often improves when the crossover aligns with a clear break of support, a lower-high structure, or broader risk/off conditions in FX.
What to Look For Before Acting
Do not assume a sustained downtrend. Consider these factors:
✅ Failure at resistance: rejection wicks or repeated failures near 1.173–1.175 on rebound attempts.
✅ Trend check: whether the sequence shifts to lower highs and lower lows from the mid-April peak area (1.182–1.185).
✅ Momentum follow-through: MACD histogram staying negative and expanding (showing increasing downside momentum rather than a one-day flip).
✅ 4-Hour or Daily alignment: look for the 4-Hour chart to also show lower-high momentum or breakdown structure (avoid relying only on the daily crossover).
✅ Volatility regime: larger daily ranges accompanying down days can suggest stronger participation than quiet drift.
✅ Macro catalyst awareness: upcoming ECB/Fed messaging, inflation/PMI prints, or US labor data that can invalidate technical signals quickly in EUR/USD.
Risk Considerations
⚠️ Whipsaw risk: MACD crossovers can flip back quickly if EUR/USD remains range-bound around 1.1660–1.1750.
⚠️ Lag risk: the crossover may confirm weakness after a meaningful portion of the pullback has already occurred.
⚠️ Support-bounce risk: nearby support around 1.1660 could trigger buying and invalidate the bearish read.
⚠️ Event risk: high-impact FX catalysts can overwhelm indicator signals and cause gap-like moves on daily charts.
Potential Next Steps
EURUSD is holding in a recovery structure after rebounding from the major demand zone at 1.1440-1.1520.
Price is currently trading around 1.1715, below the main supply zone at 1.1775-1.1840.
The broader structure is range-bound between support at 1.1440-1.1520 and resistance at 1.1775-1.1840, with a higher resistance area near 1.2050-1.2080 if buyers can break the current ceiling.Buyers have defended the 1.1660-1.1680 area several times, but momentum has slowed under resistance.
Buyers need a daily close above 1.1840 to confirm continuation, while sellers need a daily close below 1.1660 to shift control back toward a deeper pullback.
Consider keeping EUR/USD on a watchlist for price-action follow-through after the bearish crossover, particularly whether the market can break and hold below the 1.1660 support area.
Trade Idea: Bullish Continuation Scenario
Setup
The bullish setup depends on EURUSD holding above the near-term support zone at 1.1660-1.1680 and then clearing the supply zone at 1.1775-1.1840.
A daily close above 1.1840 would show buyers have absorbed the recent selling pressure and are attempting to continue the recovery toward the prior upside area around 1.1900, with a larger extension possible toward 1.2050-1.2080.
Entry
Consider entering long on a daily close above 1.1840, confirming that buyers are breaking out of the recent structure.
Alternatively, enter on a controlled pullback into 1.1660-1.1680 if price stabilizes there and turns back higher.
If price loses that support zone and closes decisively below 1.1660, stand aside and wait for either deeper support to form or a cleaner breakout later.
Stop Loss
For breakout entries: stop on a daily close back below 1.1775. That would invalidate the breakout by showing price could not stay above the former ceiling.
For pullback entries: stop on a daily close below 1.1660. That would invalidate the support-hold idea and show buyers are no longer defending the zone.
Take Profit
Target 1.2000, because that is the next clear upside area on the chart and the most natural place for price to retest if the current recovery continues.
Bottom Line
The bullish case is strongest if EURUSD closes above 1.1840 and holds above the former resistance zone at 1.1775-1.1840.
That would confirm a breakout from the recent consolidation and open the door for a move into 1.1900.
If price fails to hold 1.1660-1.1680 and closes below 1.1660, the bullish continuation idea weakens.
In that case, buyers would need to rebuild support before another attempt toward 1.1840 and 1.1900.
Trade Idea: Bearish Pullback Scenario
Setup
The bearish setup is a failure at the supply zone between 1.1775-1.1840, followed by a loss of near-term support at 1.1660.
If EURUSD cannot reclaim 1.1775-1.1840 and then breaks below 1.1660, sellers would have a cleaner path toward the next major support zone at 1.1440-1.1520.
Entry
Consider entering short on a daily close below 1.1660, confirming that the support zone has failed.
Alternatively, if price pushes into 1.1775-1.1840 and prints a clear bearish rejection candle, enter short on the next daily close back below 1.1775.
If price instead breaks and closes decisively above 1.1840, stand aside, as that would invalidate the bearish pullback idea.
Stop Loss
For breakdown entries: stop on a daily close back above 1.1680. That would invalidate the breakdown by showing price has reclaimed the support zone.
For rejection entries near resistance: stop on a daily close above 1.1840. That would invalidate the bearish idea by confirming buyers have pushed through resistance.
Take Profit
Target 1.1440-1.1520, because that is the next major support area below the current structure and the most likely place where buyers would try to step back in.
Bottom Line
The bearish case is strongest if EURUSD rejects 1.1775-1.1840 and then closes below 1.1660.
That would confirm sellers have defended resistance and forced a breakdown from the recent consolidation.
Below 1.1660, the next downside target is 1.1440-1.1520.
A daily close above 1.1840 would invalidate the bearish pullback idea and shift focus back to bullish continuation toward 1.1900.
This content is strictly for informational purposes only and does not constitute as investment advice. Trading any financial market involves risk. Please read our Risk Disclosure to make sure you understand the risks involved.


