





EUR/NZD has bounced strongly from its late-August lows and is now pushing into an area where previous rallies have struggled.
That makes this an important spot to watch. Buyers still have momentum, but the pair is also getting closer to resistance, where selling pressure could start to appear.
The next few daily candles may help show whether the move has enough strength to keep going or if a pullback is starting to develop.
Welcome to “TA Alert of the Day.” Each day after the market close, MarketMilk scans for popular technical indicator alerts. We use these alerts as the basis for a mini-lesson, breaking down what each alert means, why it matters, and how traders might interpret it. The goal is to help beginner traders not only spot these alerts but also understand the logic behind them and how they can inform trading decisions.
What MarketMilk Has Detected
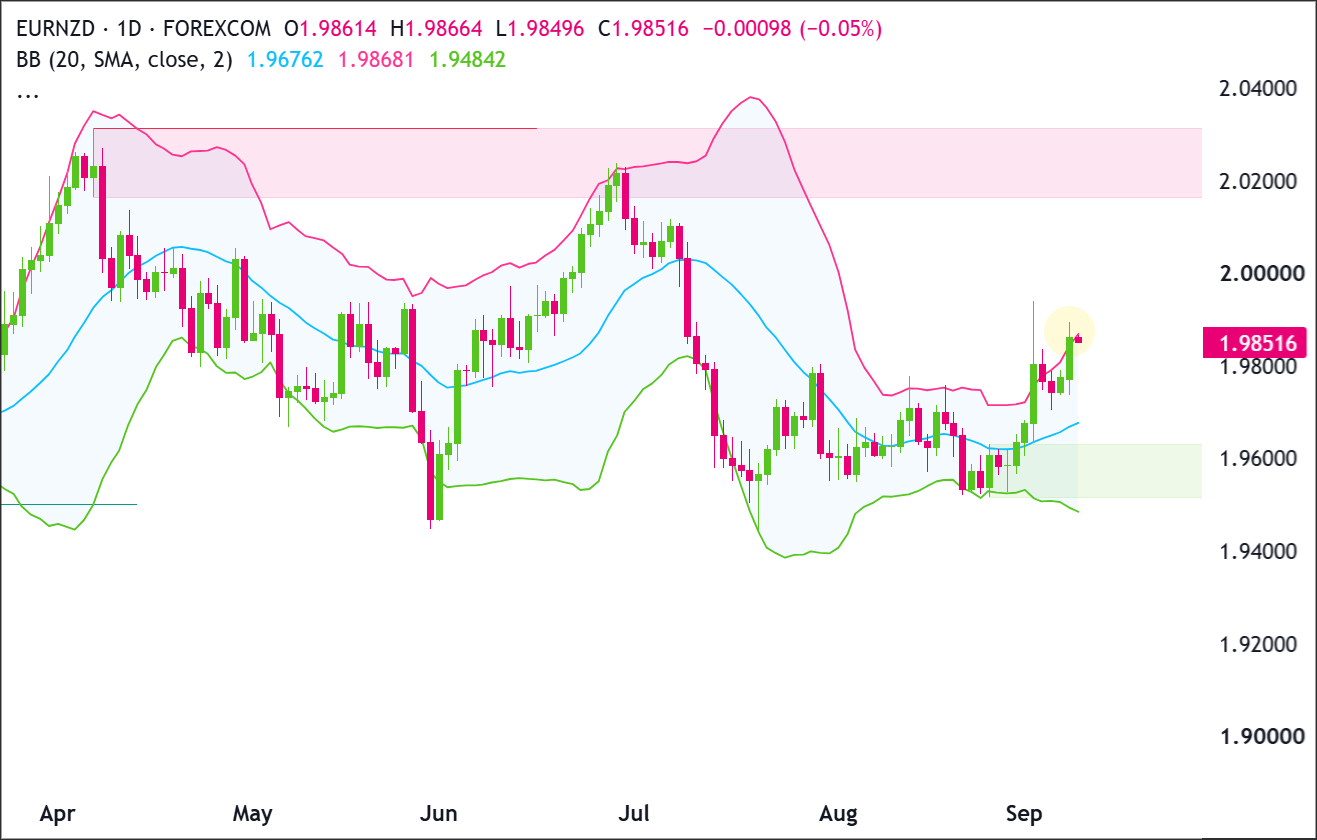
EUR/NZD closed above the upper Bollinger Band (20, 2).
This means the pair has moved unusually far above its recent average, suggesting the latest move may be getting stretched.
What This Signals
A close above the upper Bollinger Band can sometimes be a sign that price has moved too far, too quickly.
Traders looking for a pullback may watch for signs that buying momentum is starting to fade, such as a rejection candle, a lower close, or price moving back inside the bands.
But a move above the upper band does not always mean a reversal is coming. When a trend is strong, price can stay near or above the upper band for several candles.This is often called “walking the band” and can be a sign that buyers are still in control.
For EUR/NZD, the key is what happens next. A quick move back below the upper band would support the idea that the rally is losing steam.
But if price stays above the band and continues making higher closes, the move could have more room to run.
With the pair also approaching an area where previous rallies have struggled, confirmation from the next few daily candles will be especially important.
How It Works
Bollinger Bands are made up of three lines.
The middle line is usually a 20-period moving average, while the upper and lower bands sit above and below it based on recent price volatility.
When markets become more volatile, the bands spread farther apart. When price movement becomes calmer, the bands move closer together.
If price closes above the upper band, it means the market has moved unusually far above its recent average.
But that doesn’t automatically tell traders what will happen next. Price could be getting stretched and eventually move back toward the middle band, or the move could be showing strong momentum that continues pushing price higher.
Important: Band breaches are more reliable when combined with market structure (support/resistance), trend context, and subsequent candle behavior. A single close outside the band can revert quickly. Especially near established resistance, so confirmation matters more than the initial touch.
What to Look For Before Acting
Don’t assume a bearish reversal is about to happen. Instead, watch for signs that show whether buyers are losing strength or are still in control.
✅ Watch whether the next few daily candles close back inside the Bollinger Bands, which could suggest the recent move is starting to fade.
✅ Look for signs of rejection near resistance, such as long upper wicks, failed attempts to move higher, or a strong bearish candle.
✅ See whether EUR/NZD can hold above its recent breakout area, which would support the bullish case.
✅ Watch how price reacts around the next major resistance zones, especially the psychological 2.000 level.
✅ If a pullback develops, keep an eye on the middle Bollinger Band and previous resistance areas as possible support.
✅ Check whether the Bollinger Bands keep widening, which can signal that volatility and momentum are building.
✅ Look at what the weekly chart is showing, since a larger trend or resistance area can affect the daily setup.
✅ Keep an eye on EUR and NZD news, including central bank comments, interest rate expectations, and changes in overall market sentiment.
Risk Considerations
⚠️ Band-walk risk: Price can stay near or above the upper Bollinger Band for several days when a trend is strong, so don’t assume a pullback will happen right away.
⚠️ Resistance risk: An area that looks like it could stop the rally can still break, allowing price to keep moving higher.
⚠️ Whipsaw risk: Price might move back inside the band and then quickly reverse again, which can create misleading signals.
⚠️ Event risk: Economic news and central bank developments can quickly change market direction and overpower the technical setup.
Potential Next Steps
Keep EUR/NZD on your watchlist to see whether buyers can continue the recent recovery or whether price starts to pull back.
The next few daily closes should give traders a better idea of what comes next. Continued buying could open the door to the pink supply zone, while a loss of momentum could lead to a move back toward nearby support.
Technical Analysis
EUR/NZD has bounced clearly from the late-August lows, followed by several stronger daily candles into early September.
Buyers have also pushed price above the recent consolidation area around 1.9750 to 1.9800 and briefly above the upper Bollinger Band.
Buyers would likely want to see a convincing close above 1.9870 to keep the recovery moving.
If price instead falls back below the 1.9750 to 1.9800 area, the chances of a deeper pullback could increase.
Trade Idea: Bullish Continuation Scenario
Setup
The bullish setup depends on buyers turning the recent breakout attempt into a sustained move higher.
Price would need to stay supported above roughly 1.9750 to 1.9800 and then close clearly above 1.9870.
If this happens, the pink supply zone around 2.0160 to 2.0310 could become the next major area to watch.
Entry
One possible entry would be after a daily close above 1.9870, which would show that buyers are breaking above the recent price structure.
Another option would be to wait for a pullback into 1.9750 to 1.9800 and see whether buyers step back in.
If price falls below that area and closes decisively below 1.9676, the bullish setup would become weaker.
Stop Loss
For a breakout entry, a daily close back below 1.9800 could signal that the breakout has failed.
For a pullback entry, a daily close below 1.9676 could show that buyers are no longer defending support.
Take Profit
The main upside target is the 2.0160 to 2.0310 supply zone.
This area has stopped previous rallies, so it could be a natural place for traders to watch for another reaction.
Bottom Line
The bullish case becomes stronger if EUR/NZD can close above 1.9870 and stay there.
This would suggest buyers are supporting the recent breakout and could keep pushing price toward the 2.0160 to 2.0310 supply zone.
A close below 1.9676 would invalidate the bullish setup and increase the chances of a deeper pullback.
Trade Idea: Bearish Pullback Scenario
Setup
The bearish setup is based on the possibility that the recent move above the upper Bollinger Band was a short-term stretch rather than the start of a larger breakout.
Sellers would first want to see price struggle around 1.9850 to 1.9900 and then fall below nearby support.
A daily close below 1.9676 would provide stronger evidence that the recent rally is losing momentum.
Entry
One possible entry would be after a daily close below 1.9676, which would show that an important support area has failed.
Another option would be to watch for a clear bearish rejection around 1.9850 to 1.9900, followed by a close back below 1.9800.
If price instead closes clearly above 1.9900, the bearish setup would become much weaker.
Stop Loss
For a breakdown entry, a daily close back above 1.9750 could show that price has reclaimed support.
For a rejection entry near resistance, a daily close above 1.9900 could signal that buyers have regained control.
Take Profit
The main downside target is the green demand zone around 1.9510 to 1.9630.
This is the next major support area below the current price structure and could be where buyers try to step back in.
Bottom Line
The bearish case becomes stronger if EUR/NZD struggles around 1.9850 to 1.9900 and then falls below 1.9676.
This would suggest the recent rally is losing momentum and that a deeper pullback may be developing.
A move lower could bring the 1.9510 to 1.9630 demand zone back into focus, while a decisive close above 1.9900 would invalidate the bearish pullback idea.
This content is strictly for informational purposes only and does not constitute as investment advice. Trading any financial market involves risk. Please read our Risk Disclosure to make sure you understand the risks involved.



