





EUR/NZD is approaching a pivotal moment after days of sustained selling pressure.
Price is now testing a critical support zone in the mid-1.95s, where the next move could determine whether the decline pauses/reverses or extends.
A firm hold may set the stage for a sharp corrective rebound, while a decisive break lower could deepen the selloff and expose the next layer of support.
Is EUR/NZD finally ready to stabilize, or does the decline still have further to run?
Welcome to “TA Alert of the Day.” Each day after the market close, MarketMilk scans for popular technical indicator alerts. We use these alerts as the basis for a mini-lesson, breaking down what each alert means, why it matters, and how traders might interpret it. The goal is to help beginner traders not only spot these alerts but also understand the logic behind them and how they can inform trading decisions.
What MarketMilk Has Detected
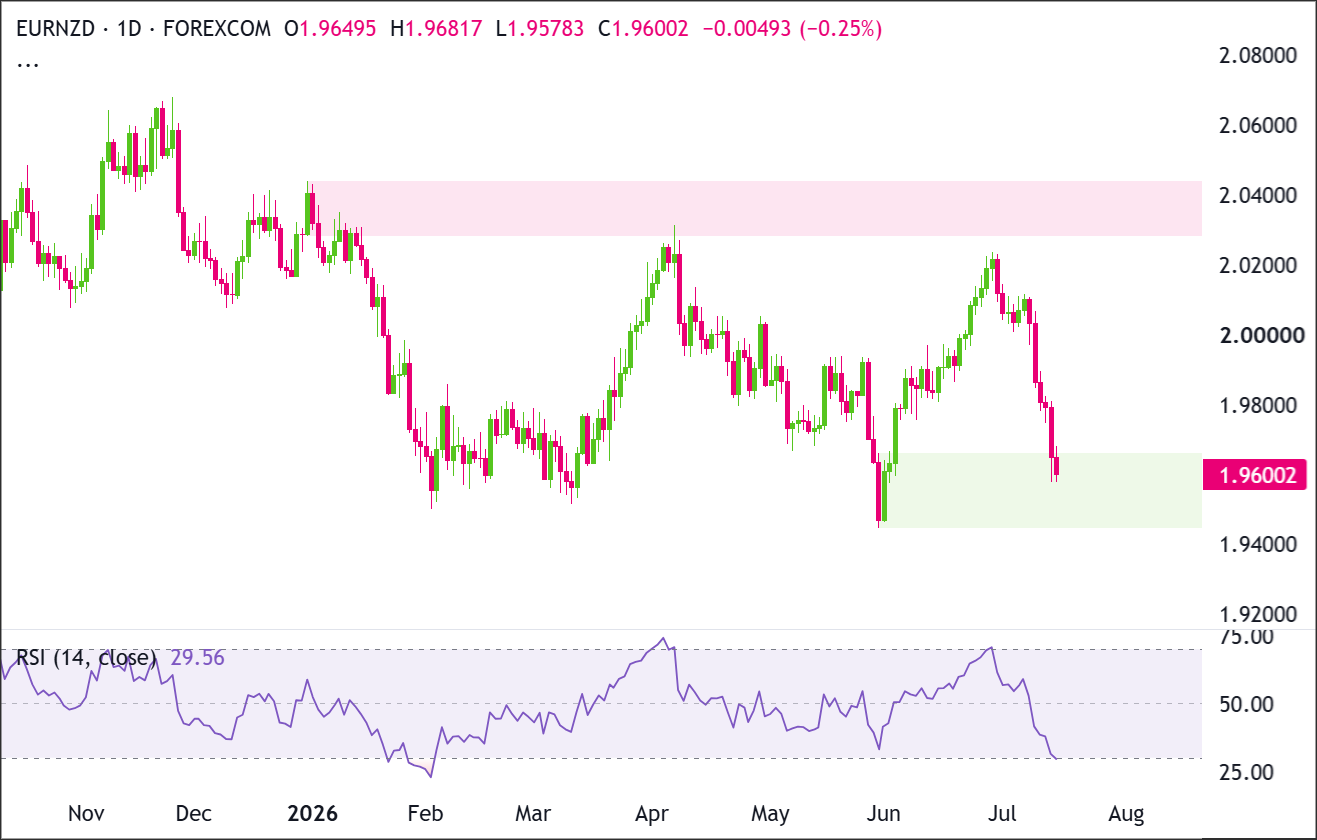
The 14-period RSI on the daily chart has dropped to 29.31, crossing below 30.00 and triggering an oversold condition.
This comes after EUR/NZD rolled over from late-June strength that peaked near the 2.0230 area and has since pulled back steadily.
What This Signals
Traditionally, an RSI move below 30 suggests that bearish momentum has become extended and can attract mean-reversion interest, especially if price is nearing a previously defended support zone.
If the move is sustained back above 30 and followed by stronger closes, the oversold condition often marks the start of a corrective rebound rather than an immediate trend change.
However, this same pattern can also represent trend strength to the downside. In persistent declines,RSI can remain oversold for multiple sessions, and attempts to bounce can fail quickly, creating dead cat bounces that roll over beneath resistance.
In that scenario, the oversold reading is less a reversal cue and more a sign that sellers are still in control as supports are tested.
Alternatively, the oversold signal may be highlighting a key decision point: EUR/NZD is coming off a pronounced drop from the 2.01–2.02 region and is now probing the mid-1.95s.
If price breaks and holds below the nearby demand zone, the market could be transitioning from a pullback into a broader downswing within the wider range.
The outcome depends heavily on follow-through price action, where the signal occurs relative to support/resistance, and whether momentum improves (RSI recovering) while price stops making fresh lows.
How It Works
The Relative Strength Index (RSI) is a momentum oscillator that measures the speed and magnitude of recent price changes, typically over 14 periods.
It oscillates between 0 and 100, with 30 commonly used as an oversold threshold and 70 as an overbought threshold. An oversold reading indicates selling pressure has been strong relative to recent history.
Because RSI is based on recent gains versus losses, it can help traders identify when momentum is becoming stretched.
Important: Oversold RSI is not a standalone buy signal. Reliability often improves when oversold readings align with a clear support level, bullish reversal candles/structure, or momentum improvement (for example, RSI turning up and reclaiming 30 while price holds a higher low).
What to Look For Before Acting
Don’t assume the oversold RSI implies an immediate reversal. Consider these factors:
✅ A daily close that holds above the nearby support zone around 1.9606, rather than sliding straight through it
✅ Evidence of stabilization: smaller real bodies, reduced downside follow-through, or a clear rejection of lows near 1.9578
✅ RSI reclaiming 30 and continuing higher over the next few sessions (momentum improvement)
✅ A break back above near-term resistance from recent swing levels (watch the 1.9657–1.9806 area from the last few closes)
✅ Whether the prior breakdown from the 2.00 handle gets retested and rejected (helps define if this is a bounce or a trend resumption)
✅ Confluence with the broader structure: Is price still making lower highs and lower lows on the daily chart?
✅ Confirmation from the Weekly chart (trend direction, major support zones, and whether the decline is a pullback or a larger reversal)
✅ Event risk for EUR and NZD (central bank communication, inflation/labor data) that could drive momentum beyond technical levels
Risk Considerations
⚠️ Oversold can persist in strong downtrends, producing repeated false “bounce” attempts
⚠️ If 1.9578 and then 1.9447 give way, downside can accelerate as stops trigger below support
⚠️ Sharp rebounds can fade quickly into resistance near 1.9657–1.9806, creating whipsaw risk
⚠️ Macro headlines can overpower RSI signals, especially around major data releases or central bank surprises
Potential Next Steps
Consider keeping EUR/NZD on a watchlist for signs of stabilization around the mid-1.95s.
The latest decline has been aggressive, with several consecutive bearish candles carrying price through 1.9800 and into the green demand zone at 1.9440–1.9660.
Buyers have not yet produced a convincing reversal candle, so they need to defend the zone and reclaim 1.9800.
Sellers need a decisive close below 1.9440 to confirm that demand has failed.
Trade Idea: Bullish Continuation Scenario
Setup
The bullish setup depends on the green demand zone at 1.9440–1.9660 holding for a second time.
A stabilization inside this area, followed by a recovery above 1.9800, would indicate that the current selloff is losing momentum and that buyers are attempting to rebuild the short-term structure.
Entry
Consider entering long on a daily close above 1.9800, confirming that buyers are breaking out of the recent structure.
Alternatively, enter on a controlled pullback into 1.9500–1.9660 if price stabilizes there and turns back higher.
If price loses that support zone and closes decisively below 1.9440, stand aside and wait for either deeper support to form or a cleaner breakout later.
Stop Loss
For breakout entries: stop on a daily close back below 1.9660. That would invalidate the breakout by showing price could not stay above the former ceiling.
For pullback entries: stop on a daily close below 1.9440. That would invalidate the support-hold idea and show buyers are no longer defending the zone.
Take Profit
Target 2.0200–2.0280, because that is the next clear upside area on the chart and the most natural place for price to retest if the current recovery continues.
Bottom Line
The bullish case requires the green demand zone at 1.9440–1.9660 to absorb the current selling pressure. A daily close above 1.9800 would provide stronger evidence that a recovery is underway.
The primary upside target is 2.0200–2.0280. A decisive daily close below 1.9440 would invalidate the bullish setup.
Trade Idea: Bearish Pullback Scenario
Setup
The bearish setup remains active while EUR/NZD trades below the recently broken 1.9800–2.0000 area.
Sellers would gain firmer control if price breaks beneath the green demand zone at 1.9440–1.9660, particularly if the breakdown occurs without a meaningful bullish reaction.
Entry
Consider entering short on a daily close below 1.9440, confirming that the support zone has failed.
Alternatively, if price pushes into 1.9800–2.0000 and prints a clear bearish rejection candle, enter short on the next daily close back below 1.9800.
If price instead breaks and closes decisively above 2.0220, stand aside, as that would invalidate the bearish pullback idea.
Stop Loss
For breakdown entries: stop on a daily close back above 1.9660. That would invalidate the breakdown by showing price has reclaimed the support zone.
For rejection entries near resistance: stop on a daily close above 2.0220. That would invalidate the bearish idea by confirming buyers have pushed through resistance.
Take Profit
Target 1.9200–1.9250, because that is the next visible downside target area below the current structure and the most likely place where buyers would try to step back in.
Bottom Line
The bearish case strengthens if a rebound fails beneath 1.9800–2.0000 or price closes below the green demand zone at 1.9440.
That would confirm that the previous support area is no longer attracting sufficient buying pressure.
The downside target is 1.9200–1.9250. A decisive close above 2.0220 would invalidate the bearish scenario.
This content is strictly for informational purposes only and does not constitute as investment advice. Trading any financial market involves risk. Please read our Risk Disclosure to make sure you understand the risks involved.



