





EUR/JPY has climbed into stretched territory near its highest levels in several weeks, putting the pair at an important crossroads.
Are the bulls still in control, or is the rally running out of gas?
A firm hold above the recent breakout zone could open the door to another leg higher.
But if buyers lose momentum and price slips back below that area, EUR/JPY may start pulling toward previous support as the pair cools off.
Welcome to “TA Alert of the Day.” Each day after the market close, MarketMilk scans for popular technical indicator alerts. We use these alerts as the basis for a mini-lesson, breaking down what each alert means, why it matters, and how traders might interpret it. The goal is to help beginner traders not only spot these alerts but also understand the logic behind them and how they can inform trading decisions.
What MarketMilk Has Detected
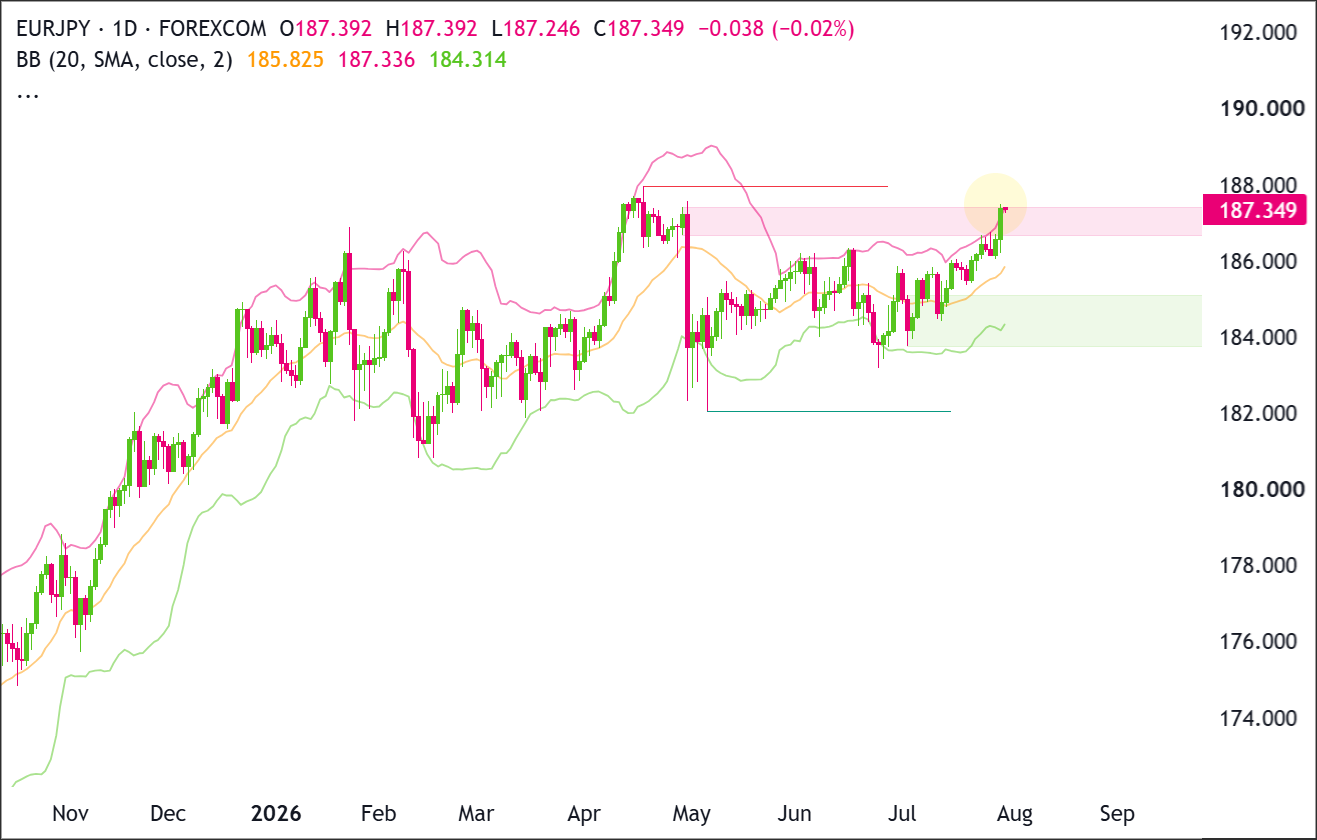
MarketMilk detected EUR/JPY closing above the upper Bollinger Band on the daily timeframe.
What This Signals
A close above the upper Bollinger Band can make mean-reversion traders perk up.
Why? Because price has moved unusually far above its 20-day average, which may mean the rally is starting to look a little stretched.
Momentum can still be strong, but if buyers run out of steam, EUR/JPY could drift back toward the middle band as price cools off and volatility settles down.
But hold your horses. An upper-band break does not automatically mean a reversal is coming.
In a strong uptrend, price can keep hugging or “walking” the upper band for several sessions.
When that happens, the move may be signaling stronger momentum and expanding volatility rather than exhaustion. In other words, what looks overbought can stay overbought longer than expected.There is also the possibility of a bull trap. EUR/JPY could briefly break above the band and nearby resistance, attract breakout buyers, and then fall back into its previous range.
This bearish scenario would become more convincing if price closes back inside the bands and the 187.40 to 187.55 area.
So, what should traders watch?
It all comes down to follow-through versus rejection. Continued closes near or above the upper band would support the bullish case, while a quick move back inside the bands would strengthen the argument for mean reversion.
The direction of the 20-day average and whether volatility keeps expanding or starts cooling off can provide additional clues.
How It Works
Bollinger Bands are built from a moving average (typically 20 periods) plus/minus a multiple of standard deviation (commonly 2).
The upper and lower bands expand when volatility increases and contract when volatility decreases, creating a dynamic “envelope” around price.
A close above the upper band indicates price is moving more than two standard deviations above its 20-day mean (using the selected settings), signaling an unusually strong move relative to recent behavior.
Because the bands respond to volatility, a breach can mean either:
- Price is temporarily extended and may revert toward the mean
- Or volatility is expanding as a trend strengthens.
That’s why traders often pair band signals with structure (support/resistance), candle behavior, and trend measures.
Important: A single close outside the bands is not, by itself, a reversal signal. In strong trends, outside-band closes can persist, and fading them too early can lead to repeated whipsaws. Confirmation from subsequent closes and nearby levels usually matters more than the initial breach.
What to Look For Before Acting
Do not assume a reversal is guaranteed. Consider these factors:
✅ Whether EUR/JPY closes back inside the Bollinger Bands within 1–3 sessions (often used as an “overshoot then fade” confirmation)
✅ Evidence of rejection candles near today’s highs (e.g., long upper wicks or a bearish engulfing-type follow-up)
✅ Whether former breakout area 186.60–186.75 holds as support on a pullback
✅ Where price sits versus the middle band (~185.66): a sharp pull toward it can indicate mean reversion is taking control
✅ If the upper band continues to rise and widen (volatility expansion) versus flattening (often seen before range behavior)
✅ Whether recent resistance near 187.40–187.55 (seen earlier in the dataset) starts acting as a ceiling again
✅ Nearby macro catalysts affecting EUR and JPY (rate expectations, central bank communication, risk sentiment) that could amplify or mute volatility
Risk Considerations
⚠️ Trend “band-walk” risk: price can remain near/above the upper band for extended periods in strong trends
⚠️ Whipsaw risk: quick re-entry into the bands can be followed by another push higher, creating false fades
⚠️ Level risk: fading into a breakout without a clear invalidation point can lead to poor risk/reward
⚠️ Event risk: FX can become volatile around policy headlines, overwhelming band-based signals
Potential Next Steps
Add EUR/JPY to a watchlist and monitor whether price accepts above the upper band (continued closes near/above it) or rejects back inside with weakening candles.
EUR/JPY remains in a constructive recovery structure, with higher swing lows forming from the May low near 182.050.
Price is now testing the 186.700–187.500 supply zone while closing around the upper Bollinger Band at 187.336, showing strong momentum but also increased rejection risk.
Buyers need a decisive close above 187.500, followed by a break of 188.000, to confirm continuation.
Sellers need a rejection from the current zone and a move below 185.825 to disrupt the sequence of higher lows.
Trade Idea: Bullish Continuation Scenario
Setup
The bullish setup depends on EUR/JPY holding above the Bollinger Band midpoint and recent breakout area around 185.825–186.000.
A daily close above the 186.700–187.500 supply zone would confirm that buyers are absorbing overhead selling pressure.
Entry
Enter long on a daily close above 187.500, confirming that buyers are breaking out of the recent structure.
Alternatively, enter on a controlled pullback into 185.825–186.000 if price stabilizes there and turns back higher.
If price loses that support zone and closes decisively below 185.500, stand aside and wait for either deeper support to form or a cleaner breakout later.
Stop Loss
For breakout entries: stop on a daily close back below 186.700. That would invalidate the breakout by showing price could not stay above the former ceiling.
For pullback entries: stop on a daily close below 185.500. That would invalidate the support-hold idea and show buyers are no longer defending the zone.
Take Profit
Target 190.000, because that is the next clear upside area on the chart and the most natural place for price to retest if the current recovery continues.
Bottom Line
The bullish case strengthens on a confirmed daily close above 187.500, which would show that EUR/JPY has cleared the visible supply zone.
A close below 185.500 would invalidate the near-term continuation setup by placing price back beneath the Bollinger midpoint and weakening the recent higher-low structure.
Trade Idea: Bearish Pullback Scenario
Setup
The bearish setup centers on a rejection from the 186.700–187.500 supply zone, particularly with price already pressing against the upper Bollinger Band at 187.336.
Sellers would gain stronger control if EUR/JPY falls back below the Bollinger midpoint and recent breakout support at 185.825. That would expose the 183.800–185.100 demand zone.
Entry
Consider entering short on a daily close below 185.825, confirming that the support zone has failed.
Alternatively, if price pushes into 186.700–187.500 and prints a clear bearish rejection candle, enter short on the next daily close back below 186.600.
If price instead breaks and closes decisively above 188.000, stand aside, as that would invalidate the bearish pullback idea.
Stop Loss
For breakdown entries: stop on a daily close back above 186.000. That would invalidate the breakdown by showing price has reclaimed the support zone.
For rejection entries near resistance: stop on a daily close above 188.000. That would invalidate the bearish idea by confirming buyers have pushed through resistance.
Take Profit
Target 183.800–185.100, because that is the next major demand area below the current structure and the most likely place where buyers would try to step back in.
Bottom Line
The bearish case depends on EUR/JPY failing inside the 186.700–187.500 supply zone and subsequently breaking below 185.825.
That would signal that the upper Bollinger Band test has produced exhaustion rather than a sustained breakout.
The primary downside target is the 183.800–185.100 demand zone. A decisive daily close above 188.000 would invalidate the bearish scenario and confirm that buyers have cleared the previous swing high.
This content is strictly for informational purposes only and does not constitute as investment advice. Trading any financial market involves risk. Please read our Risk Disclosure to make sure you understand the risks involved.



