


EUR/GBP has been pressing into the upper end of its recent range, but momentum conditions are starting to change.
After a strong push higher, the latest daily candle pulled back and the oscillator has begun to roll over from elevated levels.
This is the type of shift that often gets attention because it can appear near short-term turning points.
The next few sessions will help clarify whether this is just a pause or the start of a broader momentum reset.
Welcome to “TA Alert of the Day.” Each day after the market close, MarketMilk scans for popular technical indicator alerts. We use these alerts as the basis for a mini-lesson, breaking down what each alert means, why it matters, and how traders might interpret it. The goal is to help beginner traders not only spot these alerts but also understand the logic behind them and how they can inform trading decisions.
What MarketMilk Has Detected
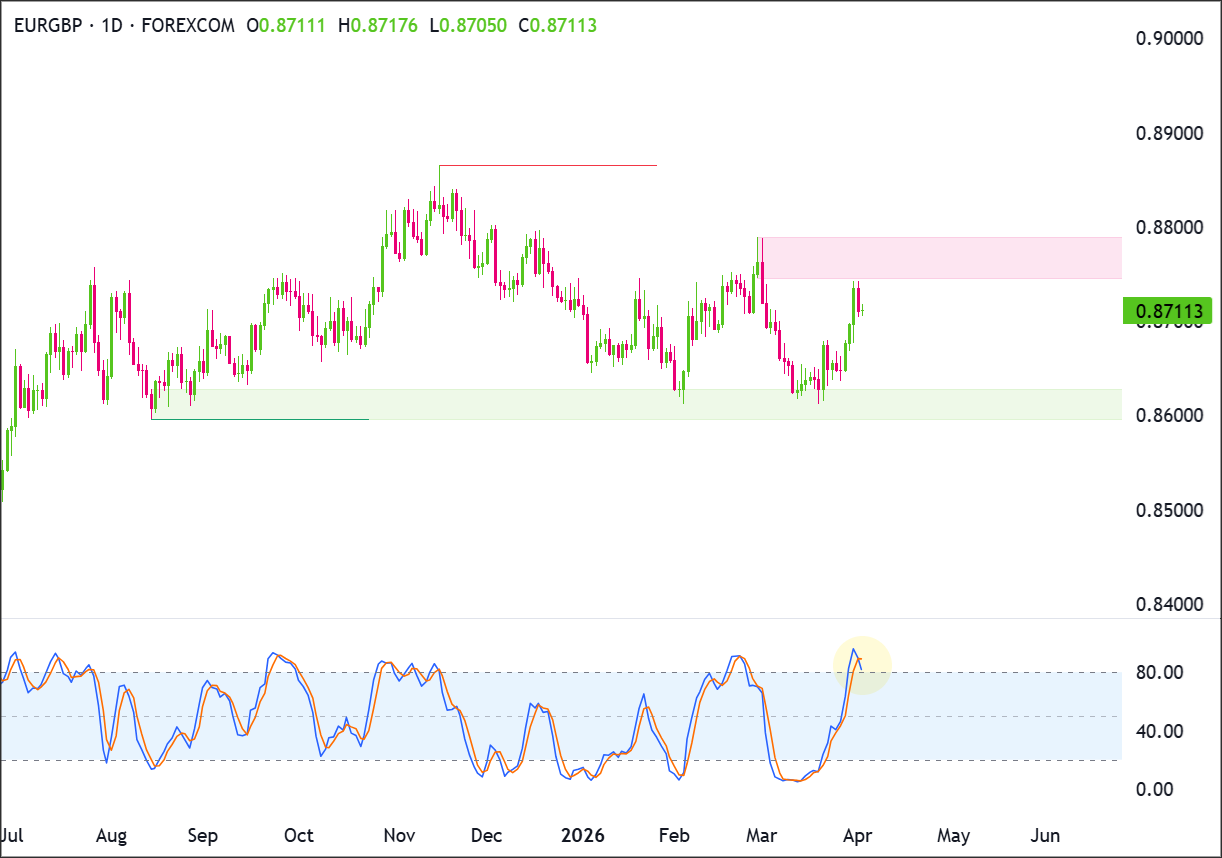
MarketMilk detected a bearish Stochastic crossover on the 1d timeframe: the %K line crossed below the %D line.
Notably, both lines remain in overbought momentum territory (above 80), which signals that the crossover is occurring while recent upside momentum is still elevated.
Price also slipped on the session, pulling back from the recent upswing that ran from the mid-March base near 0.862–0.866 up toward 0.873–0.876.
Nearby reference levels from recent price action include resistance around 0.874–0.876 (late-February/late-March highs) and support zones around 0.869–0.870 first, then 0.864–0.866.
Stronger support is 0.8600–0.8620 (major demand zone / range floor).
A daily close below 0.8600 would weaken the current range structure and raise the risk of a deeper breakdown.
What This Signals
Traditionally, a %K below %D crossover while Stochastic is above 80 suggests that upside momentum is cooling after an extended push.
If the move is sustained, this kind of rollover can attract mean-reversion sellers and often marks the start of a pullback toward nearer supports, especially when it appears close to a well-watched resistance area (here, the 0.874–0.876 region).
However, this same pattern can also represent a brief reset within a strong upswing.
In trending markets, Stochastic can remain elevated for longer than traders expect, and crossovers above 80 sometimes coincide with only shallow dips before buyers return.
That “false rollover” risk tends to rise if price quickly reclaims the prior day’s high area and holds above 0.872–0.873.
Alternatively, the crossover may indicate distribution near the top of a range, where prices briefly push higher but struggle to follow through.
In that scenario, repeated failures to regain 0.873–0.874 can keep momentum heavy and increase the odds of rotation back toward the middle of the recent multi-week band.
The outcome depends heavily on follow-through in price action, the strength of nearby support levels, and whether momentum continues to unwind from overbought territory.
Context and confirmation are essential, particularly because oscillators can give early signals that take time to resolve.
How It Works
The Stochastic oscillator (14,3,3) compares the latest close to the recent high-low range over a lookback period (here, 14 bars).
The %K line measures where price sits within that range, and the %D line is a smoothed average of %K.
A bearish signal occurs when %K crosses below %D, suggesting the most recent price action is weakening relative to the recent range.
Readings above 80 are commonly described as overbought momentum—not a valuation call, but a sign that price has been closing near the top of its recent range.
Crossovers in this zone are watched because they can reflect a shift from “strong closes” to “less strong closes,” often preceding consolidation or pullbacks.
Important: Stochastic signals can be early and can “whipsaw” in choppy ranges. Reliability often improves when the crossover is paired with clear price confirmation. For example, a break of a nearby support. Or when momentum continues to fall out of the overbought zone rather than snapping back immediately.
What to Look For Before Acting
Do not assume an immediate downside reversal. Consider these factors:
✅ Whether EUR/GBP closes below 0.869–0.870 (near-term support from recent trade)
✅ Signs that Stochastic continues to unwind (e.g., %K and %D dropping toward/through 80) rather than re-turning higher
✅ A lower-high/lower-close sequence on the daily candles (follow-through selling after the crossover)
✅ Reaction around the recent resistance band near 0.874–0.876 (rejection vs. reclaim)
✅ Whether the pullback holds above 0.864–0.866 (mid-March base area) or breaks into it
✅ The size of daily ranges: expanding ranges on down days can add weight to the bearish momentum shift
✅ Confluence with structure: does price roll over from a prior swing high or a repeated failure zone?
✅ Alignment on a higher timeframe (check Weekly structure for broader range/trend context)
✅ Upcoming UK/EZ macro catalysts (rate expectations, inflation releases, central bank commentary) that could drive volatility beyond what the oscillator implies
Risk Considerations
⚠️ Trend persistence risk: Stochastic can stay elevated in strong moves; a crossover above 80 can fail quickly.
⚠️ Whipsaw risk: If EUR/GBP remains range-bound, %K/%D can cross multiple times without clean direction.
⚠️ Level risk: Selling into support near 0.869–0.870 can lead to choppy fills and snapbacks.
⚠️ Event risk: Macro headlines can invalidate oscillator signals with gap-like moves or sudden volatility spikes.
Potential Next Steps
Consider placing EUR/GBP on a watchlist for confirmation vs. failure of the momentum rollover.
Some traders wait for a daily close below nearby support (or a clear rejection from 0.873–0.874) before treating the crossover as actionable, while others monitor whether Stochastic falls out of the overbought zone as added confirmation.
Whichever approach is used, position sizing and predefined exit logic can help manage the risk of whipsaws common to oscillator-based signals.
Trade Idea (Bearish Rejection Scenario)
Setup:
Look for a bearish rotation if price continues to reject the 0.8745–0.8780 supply zone and starts rolling back over, signaling that sellers are still defending the top half of the range.
Entry:
Enter short on a daily close below 0.8690 after rejection from the supply zone.
Alternatively, if price rallies further into 0.8760–0.8780 and prints a clear bearish rejection candle, enter short on the next daily close back below 0.8720.
If price instead breaks and closes decisively above 0.8780, stand aside, as that would invalidate the bearish setup and favor bullish continuation.
Stop Loss:
For breakdown entries: stop on a daily close back above 0.8720.
That would invalidate the breakdown by showing price has reclaimed the short-term support area.
For rejection entries near resistance: stop on a daily close above 0.8790.
That would invalidate the bearish idea by confirming that supply has failed and price is breaking higher.
Take Profit:
Target 0.8600. It’s the next major support area and the most likely place where buyers would try to step back in.
Alternatively, you can take partial profit and watch if 0.8600 can hold. If it doesn’t, target 0.8500.
Bottom line:
EURGBP is testing a supply zone with momentum already stretched.
If that area holds, the pair could rotate back toward 0.8600. But if buyers manage to clear 0.8780, the bearish range-rejection idea is no longer valid.
Trade Idea (Bullish Continuation Scenario)
Setup:
Look for continuation higher if price can break and hold above the 0.8745–0.8780 supply zone, confirming that buyers are strong enough to push EURGBP out of the current range.
Entry:
Enter long on a daily close above 0.8780.
Alternatively, enter on a controlled pullback that holds above 0.8740–0.8750 after the breakout.
If price pushes into the zone but fails to break through and instead prints a clear rejection candle, stand aside and wait for either a deeper pullback or a cleaner breakout later.
Stop Loss:
For breakout entries: stop on a daily close back below 0.8740.
That would invalidate the breakout by showing price could not stay above former resistance.
For pullback entries: stop on a daily close below 0.8700.
That would invalidate the support-hold idea and show the breakout is losing momentum.
Take Profit:
Target 0.9000. If EUR/GBP breaks above the current range and continues higher, it is open skies but resistance at a psychological round number would be expected.
Bottom line:
EURGBP has rebounded into a key supply zone.
A confirmed break above 0.8780 would improve the chart and open room toward 0.8850, while failure in this area would suggest the pair is still stuck inside the broader range.
This content is strictly for informational purposes only and does not constitute as investment advice. Trading any financial market involves risk. Please read our Risk Disclosure to make sure you understand the risks involved.


