





EUR/GBP has been moving higher since mid-July, but that momentum may be starting to fade.
The pair recently pulled back from its early September highs, and the MACD indicator has now turned bearish on the daily chart. That doesn’t automatically mean price will keep falling, but it does suggest buyers may be losing some strength.
The next few days could show whether this is just a normal pullback or the start of a bigger move lower..
Welcome to “TA Alert of the Day.” Each day after the market close, MarketMilk scans for popular technical indicator alerts. We use these alerts as the basis for a mini-lesson, breaking down what each alert means, why it matters, and how traders might interpret it. The goal is to help beginner traders not only spot these alerts but also understand the logic behind them and how they can inform trading decisions.
What MarketMilk Has Detected
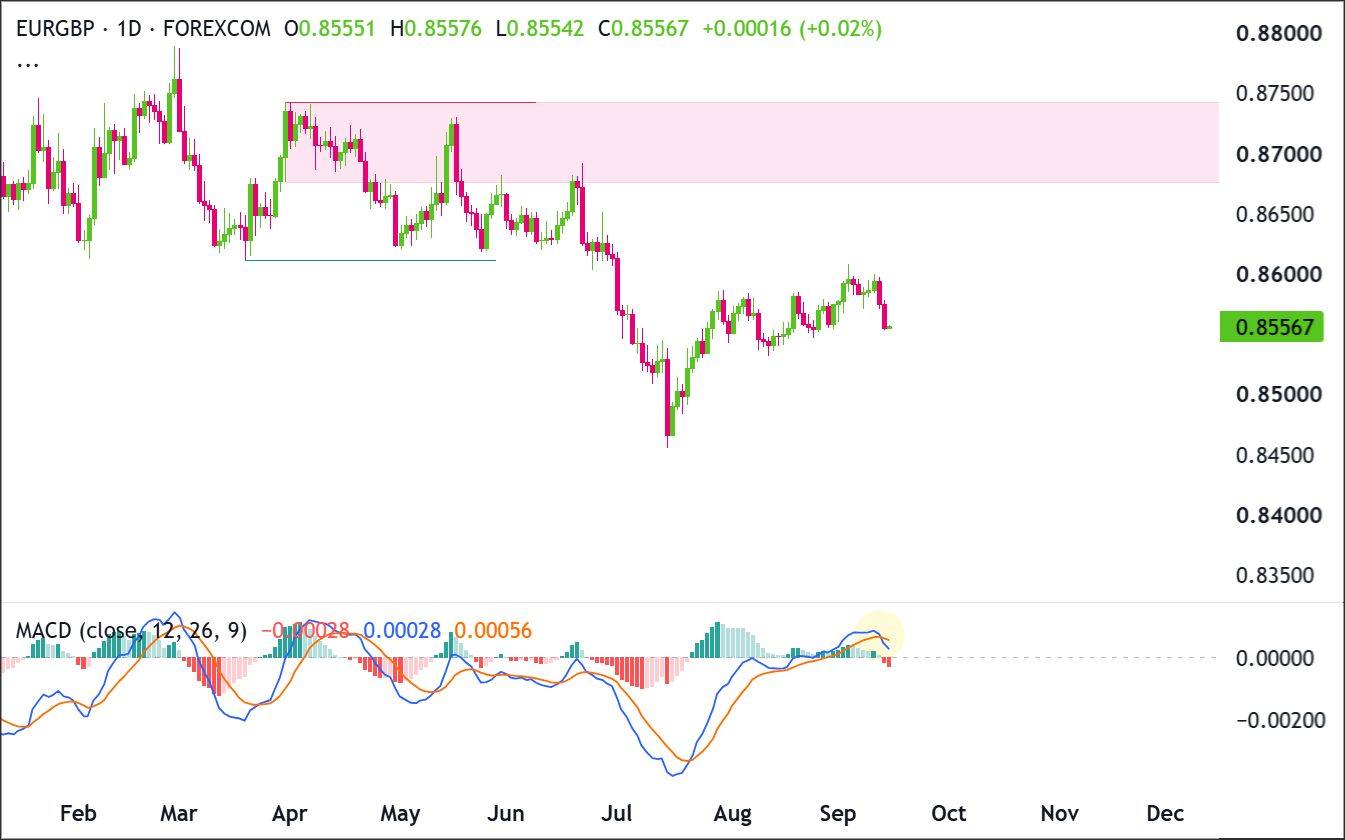
MarketMilk detected a bearish MACD(12,26,9) crossover on EUR/GBP’s daily chart.
This happened when the MACD line crossed below the signal line, which can be a sign that upward momentum is starting to weaken.
The crossover comes as EUR/GBP has pulled back from its early September highs, adding to signs that the pair’s recent upward momentum may be fading.
What This Signals
A bearish MACD crossover usually means upward momentum is starting to weaken. If price also starts making lower highs and lower lows, it can be a sign that sellers are gaining more control.
That matters for EUR/GBP because the pair had been moving higher from July into early September. The bearish crossover suggests that rally may be losing steam, especially if price starts breaking below nearby support.
But a bearish crossover doesn’t always mean a bigger move lower is coming. Sometimes MACD turns bearish during a normal pullback, and price starts climbing again soon after.If EUR/GBP holds support and begins moving higher again, the crossover could simply be a temporary pause in the uptrend.
That’s why it’s important to watch what price does next. A break below support would give the bearish signal more weight, while a strong bounce could suggest buyers are still in control.
How It Works
MACD (Moving Average Convergence Divergence) is an indicator that helps traders see whether momentum is getting stronger or weaker.
It compares two moving averages of price and turns that difference into the MACD line. A second line, called the signal line, follows the MACD line.
A bearish crossover happens when the MACD line moves below the signal line. This can be a sign that buying momentum is fading and sellers may be starting to gain strength.
MACD is mainly used to confirm changes in momentum and trend. It doesn’t predict exactly when price will turn, so traders often use it alongside support and resistance and other clues from price action.
Important: MACD can whipsaw in range-bound markets, producing multiple crossovers without sustained direction. The quality of the signal typically improves when the crossover aligns with a clear break of support/resistance or a noticeable change in swing structure.
What to Look For Before Acting
Do not assume EUR/GBP will extend lower just because the MACD has crossed bearish. Consider these factors:
✅ Whether price holds or breaks the nearby support band around 0.8550–0.8540.
✅ A follow-through close below recent consolidation lows, which would reduce the risk of a one-candle crossover.
✅ Signs of sellers defending rebounds into 0.8575–0.8590, with former short-term support potentially turning into resistance.
✅ Whether the pullback stays orderly or starts to accelerate.
✅ Whether the MACD histogram continues to print deeper negative values, which can point to strengthening downside momentum.
✅ Whether price starts forming lower highs after failing near 0.8595–0.8608.
✅ Whether the Weekly trend supports the bearish signal.
✅ Upcoming UK and EU economic events that could quickly change the technical picture.
Risk Considerations
⚠️ Whipsaw risk: EUR/GBP has traded sideways at times, so the MACD crossover could quickly reverse.
⚠️ Support proximity: Bearish signals can fail when they appear near support, especially if buyers step in around 0.8550–0.8540.
⚠️ Event risk: Unexpected UK or EU news can cause sharp moves that overwhelm the technical setup.
⚠️ False breakdown risk: Price could briefly break below support, then quickly reverse higher.
Potential Next Steps
Add EUR/GBP to a watchlist and keep an eye on the 0.8535–0.8550 area.
If price falls below nearby support, the July swing low at 0.8455 could come back into focus. If buyers regain control and push price above 0.8600, EUR/GBP could start moving toward the pink supply zone at 0.8675–0.8740.
Technical Analysis
EUR/GBP had been gradually moving higher after the July swing low at 0.8455, but buyers have struggled several times around 0.8590–0.8600.
The latest completed candle moved lower from this area, showing that sellers are beginning to push back.
Buyers now need to keep price above 0.8535–0.8550 and eventually break above 0.8600. Sellers would gain more control if price closes below 0.8535.
Trade Idea: Bullish Continuation Scenario
Setup
The bullish setup depends on EUR/GBP holding the 0.8535–0.8550 support zone and then moving above 0.8600.
A daily close above 0.8600 would show that buyers are taking control again.
If this happens, the next major area to watch would be the pink supply zone at 0.8675–0.8740.
Entry
Consider entering long on a daily close above 0.8600, confirming that buyers are breaking above the recent highs.
Alternatively, enter on a controlled pullback into 0.8535–0.8550 if price settles there and then starts moving higher again.
If price loses this support zone and closes clearly below 0.8535, stand aside. This would invalidate the short-term bullish setup.
Stop Loss
For breakout entries: stop on a daily close back below 0.8580. This would invalidate the breakout because price failed to stay above the previous resistance area.
For pullback entries: stop on a daily close below 0.8535. This would invalidate the idea that buyers are defending support.
Take Profit
Target 0.8675, because this is the bottom of the pink supply zone and the next clear resistance area above price.
Bottom Line
The bullish setup becomes more interesting if EUR/GBP holds 0.8535–0.8550 and then closes above 0.8600. This could open the door to a move toward 0.8675.
A daily close below 0.8535 would invalidate this bullish idea because it would show that buyers are losing control of nearby support.
Trade Idea: Bearish Pullback Scenario
Setup
The bearish setup is becoming more interesting because EUR/GBP has struggled around 0.8590–0.8600, while the MACD line has crossed below the Signal line.
The large pink supply zone at 0.8675–0.8740 also remains above price and could attract sellers if EUR/GBP tries to rally again.
For sellers to take stronger control, price still needs to break below 0.8535.
Entry
Consider entering short on a daily close below 0.8535, confirming that support has broken.
Alternatively, if price moves back into 0.8590–0.8600 and forms a clear bearish rejection candle, enter short on the next daily close below 0.8575.
If price instead breaks and closes clearly above 0.8600, stand aside. This would invalidate the near-term bearish setup.
Stop Loss
For breakdown entries: stop on a daily close back above 0.8550. This would invalidate the breakdown because price would have moved back above the broken support area.
For rejection entries near resistance: stop on a daily close above 0.8600. This would invalidate the bearish idea because buyers would have broken through recent resistance.
Take Profit
Target 0.8455, because this is the July swing low and the next major support level below the current price structure.
Bottom Line
The bearish setup remains possible while EUR/GBP stays below 0.8590–0.8600. The MACD crossover also suggests that the recent upward momentum is starting to fade.
A daily close below 0.8535 would strengthen the bearish case and could send price toward the July swing low at 0.8455. A clear close above 0.8600 would invalidate this short-term bearish setup.
This content is strictly for informational purposes only and does not constitute as investment advice. Trading any financial market involves risk. Please read our Risk Disclosure to make sure you understand the risks involved.



