





EUR/CAD has rebounded sharply from support and is now testing the upper boundary of its recent range.
Price is pressing into the 1.6200–1.6265 supply zone, where previous advances have struggled, while Stochastic is beginning to turn lower from overbought territory.
A clear rejection could trigger a pullback toward 1.6020, while a sustained break above 1.6265 would strengthen the bullish case and bring the previous swing high at 1.6400 into focus.
Welcome to “TA Alert of the Day.” Each day after the market close, MarketMilk scans for popular technical indicator alerts. We use these alerts as the basis for a mini-lesson, breaking down what each alert means, why it matters, and how traders might interpret it. The goal is to help beginner traders not only spot these alerts but also understand the logic behind them and how they can inform trading decisions.
What MarketMilk Has Detected
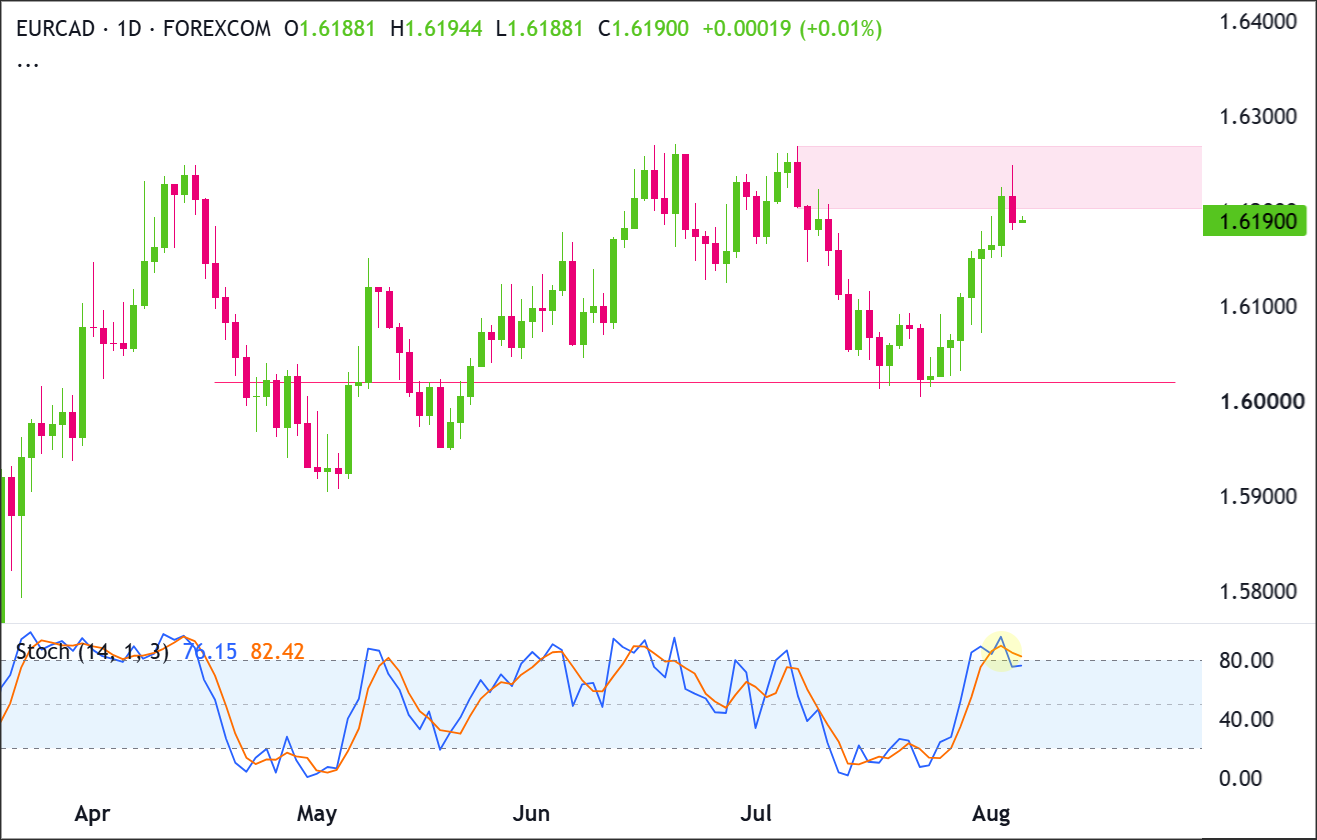
MarketMilk detected a bearish Stochastic crossover on the daily timeframe, with %K crossing below %D.
Both lines remain above 80, keeping the oscillator in overbought momentum territory rather than a neutral zone.
EUR/CAD has repeatedly moved between the 1.6000–1.6060 and 1.6215–1.6270 regions. This crossover is notable because it’s occurring near the upper boundary, where previous rallies have stalled.
What This Signals
Traditionally, a Stochastic %K cross below %D while above 80 suggests that upside momentum is fading after an extended push.
In range-like conditions, this type of signal can attract mean reversion traders because it often marks a transition from “accelerating” to “decelerating” momentum if the move is sustained.
However, this same pattern can also represent a brief pause within an ongoing uptrend.Stochastic can “work off” overbought momentum through time rather than price, and crossovers above 80 sometimes whipsaw while price holds firm.
Especially if EUR/CAD remains bid above nearby support and quickly reclaims the prior highs.
The outcome depends heavily on follow-through in price action, where the crossover occurs relative to resistance (the 1.6250–1.6270 supply zone), and whether the pair can hold key support from the latest upswing.
How It Works
The Stochastic oscillator compares the current close to the recent 14-period high-low range to gauge momentum.
The %K line is the faster momentum line, while %D is a smoothed signal line; crossovers are commonly used to highlight shifts in momentum.
Readings above 80 indicate overbought momentum (strong upside pressure relative to the recent range), while readings below 20 indicate oversold momentum.
A bearish crossover above 80 highlights that momentum is rolling over from elevated levels. But it does not, by itself, confirm a price reversal.
Important: Stochastic signals tend to be more reliable when they align with structure (clear resistance/support), and less reliable during strong directional trends where the oscillator can remain overbought/oversold and generate multiple false crossovers.
What to Look For Before Acting
Don’t assume a bearish reversal. Consider these factors:
✅ Whether EUR/CAD rejects the 1.6250–1.6270 resistance zone again (failed retest or lower high)
✅ A daily close below 1.6170–1.6145 (recent swing support area) to show downside follow-through
✅ A move toward (and ideally below) Stochastic 80, showing momentum is leaving the overbought regime rather than just crossing briefly
✅ Evidence of sellers defending highs via long upper wicks or multiple failed pushes above ~1.6240–1.6250
✅ Whether price revisits the mid-range pivot near 1.6090–1.6060, an area that has acted as a recurring rotation zone
✅ If support around 1.6020–1.6000 (prior base area) becomes the next downside magnet or holds firmly
✅ Confirmation on a Weekly view (trend/structure), since the signal is on the daily timeframe
✅ Any EUR- or CAD-sensitive catalysts (interest rate expectations, central bank communication, risk sentiment) that could override oscillator signals
Risk Considerations
⚠️ Whipsaw risk: Stochastic crossovers above 80 can flip back quickly if price consolidates rather than reverses
⚠️ Trend persistence: Overbought momentum can persist; selling purely because it’s “overbought” can be costly
⚠️ Resistance not confirmed: If 1.6250–1.6270 breaks and holds, the signal may fail as price transitions to a new range
⚠️ Event risk: Macro headlines can cause gaps/large candles that invalidate oscillator-based timing
Potential Next Steps
Place EUR/CAD on a watchlist and watch whether the latest recovery can break through nearby supply or stalls as momentum begins to cool.
EUR/CAD has rebounded strongly from the 1.6020 support area but is now testing a major supply zone at 1.6200–1.6265.
The broader structure remains range-bound between 1.6020 support and 1.6265 resistance. Stochastic has rolled over near overbought territory, suggesting bullish momentum is beginning to cool as price reaches resistance.
The latest rally produced a sequence of higher daily candles before buyers met resistance inside 1.6200–1.6265.
Buyers need a decisive close above 1.6265, while sellers need price to lose 1.6150 to confirm that a deeper pullback is developing.
Trade Idea: Bullish Continuation Scenario
Setup
The bullish setup depends on EUR/CAD holding the 1.6150–1.6190 area and eventually breaking through the 1.6200–1.6265 supply zone.
A confirmed breakout above 1.6265 would clear the recent swing highs and signal that buyers have regained control despite the cooling Stochastic momentum.
Entry
Consider entering long on a daily close above 1.6265, confirming that buyers are breaking out of the recent structure.
Alternatively, enter on a controlled pullback into 1.6150–1.6190 if price stabilizes there and turns back higher.
If price loses that support zone and closes decisively below 1.6150, stand aside and wait for either deeper support to form or a cleaner breakout later.
Stop Loss
For breakout entries: stop on a daily close back below 1.6200. That would invalidate the breakout by showing price could not stay above the former ceiling.
For pullback entries: stop on a daily close below 1.6150. That would invalidate the support-hold idea and show buyers are no longer defending the zone.
Take Profit
Target 1.6400, because that is the last major swing high and the most natural upside objective if price breaks through the current supply zone and extends the recovery.
Bottom Line
The bullish case strengthens only if EUR/CAD closes above 1.6265, clearing the full resistance zone and opening the way toward the previous swing high at 1.6400.
Until that happens, the Stochastic rollover leaves the breakout vulnerable. A daily close below 1.6150 would invalidate the immediate bullish setup.
This EUR/CAD trade idea hinges on a defined supply zone at 1.6200-1.6265 and a support zone at 1.6150-1.6190, concepts that go beyond simple support and resistance lines. Premium members can read our lesson:
📖 Beyond Support and Resistance: Supply and Demand Zones
Reading this helps you understand why zones work better than single price lines, how to grade the quality of a zone before trading it, and how to judge whether a breakout like the one this setup requires actually confirms buyers are in control.
And if you’re not a Premium subscriber yet, now’s a good time to sign up.
With Babypips Premium, you get full access to School of Pipsology lessons that help you understand not just where a level sits on the chart, but why that level holds weight and how to judge a breakout through it.
Trade Idea: Bearish Pullback Scenario
Setup
The bearish setup is based on EUR/CAD failing inside the 1.6200–1.6265 supply zone while Stochastic turns lower from overbought territory. Sellers would gain stronger control if price breaks below 1.6150, exposing the major support area at 1.6020.
Entry
Consider entering short on a daily close below 1.6150, confirming that the immediate support zone has failed.
Alternatively, if price pushes into 1.6200–1.6265 and prints a clear bearish rejection candle, enter short on the next daily close back below 1.6190.
If price instead breaks and closes decisively above 1.6265, stand aside, as that would invalidate the bearish pullback idea.
Stop Loss
For breakdown entries: stop on a daily close back above 1.6200. That would invalidate the breakdown by showing price has reclaimed the support zone.
For rejection entries near resistance: stop on a daily close above 1.6265. That would invalidate the bearish idea by confirming buyers have pushed through resistance.
Take Profit
Target 1.6020, because that is the next major support area below the current structure and the most likely place where buyers would try to step back in.
If 1.6020 can’t hold and price closes decisively below it, extend the downside target to 1.5950.
Bottom Line
The bearish case remains active while EUR/CAD fails beneath the 1.6200–1.6265 resistance zone. A daily close below 1.6150 would confirm weakening structure and place 1.6020 back in focus.
A decisive breakdown below 1.6020 would expose 1.5950. The bearish scenario is invalidated by a daily close above 1.6265.
This content is strictly for informational purposes only and does not constitute as investment advice. Trading any financial market involves risk. Please read our Risk Disclosure to make sure you understand the risks involved.



