Gold (XAU/USD) is under renewed pressure as price struggles to regain upside traction after its recent decline.
With the pair hovering above a key support zone near the 4000 area and sellers still defending rebounds, the next few sessions could help determine whether downside momentum continues or buyers step in to stabilize the market.
Welcome to “TA Alert of the Day.” Each day after the market close, MarketMilk scans for popular technical indicator alerts. We use these alerts as the basis for a mini-lesson, breaking down what each alert means, why it matters, and how traders might interpret it. The goal is to help beginner traders not only spot these alerts but also understand the logic behind them and how they can inform trading decisions.
What MarketMilk Has Detected
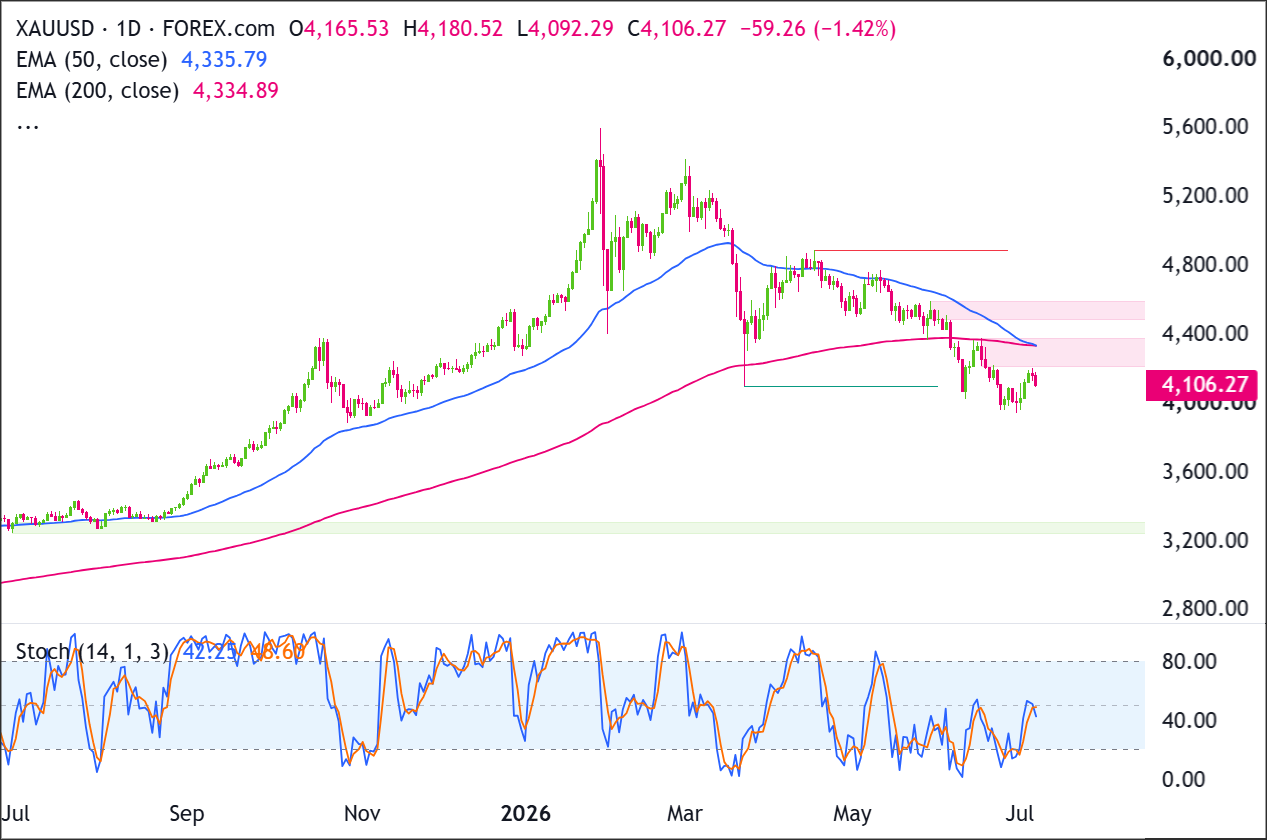
MarketMilk detected a 50-day EMA crossing below the 200-day EMA on the 1D timeframe, a classic bearish “death cross” condition.
This alert arrives after a pronounced selloff from the early-April highs near 4850, followed by a series of lower highs and repeated failures to reclaim the mid-4300s.
Price also recently tested below the 4000 area (late June lows around 3959) before bouncing back toward the low-4200s.
This suggests the market is still actively probing key support and resistance zones.
Death Cross?
It’s called a “death cross” because the shorter-term moving average crossing below the longer-term moving average creates a bearish “cross” on the chart.
The “death” part reflects the idea that upside momentum may be fading and the prior bullish trend could be losing strength.
Despite the dramatic name, it shouldn’t be treated as a guaranteed sell signal. It’s a warning sign that still needs confirmation from price action.
What This Signals
A bearish 50/200 EMA crossover suggests that recent price weakness has lasted long enough to pull the medium-term trend below the longer-term trend.
When sustained, this setup can attract trend-following traders and often marks a period where rallies into moving average resistance levels are sold, especially if price remains below both EMAs.
However, this same pattern can also represent a lagging confirmation that appears after a large portion of the move has already occurred.
In markets that are trying to base, the “death cross” sometimes coincides with late-stage selling, where prices briefly dip, then stabilize and reclaim key levels…turning the crossover into a whipsaw rather than the start of a fresh leg lower.Alternatively, if XAU/USD continues to oscillate around the psychologically important 4000 area and buyers repeatedly defend the late-June low region (~3960), the crossover may end up reflecting mean-reversion dynamics.
In this scenario, the market could focus more on horizontal levels than on moving averages.
The outcome depends heavily on follow-through after the cross, the market’s ability (or inability) to reclaim the mid-4300s, and how price behaves around the late-June support band.
How It Works
The Exponential Moving Average (EMA) weights recent prices more heavily than older prices, making it more responsive than a simple moving average.
The 50 EMA is commonly used to represent the medium-term trend, while the 200 EMA is treated as a proxy for the long-term trend.
A bearish crossover occurs when the 50 EMA falls below the 200 EMA, indicating that recent price action has deteriorated relative to the longer-term average.Because EMAs are derived from past prices, this signal is inherently lagging: it confirms that weakness has been persistent, not that a new move must start immediately.
Watch how price reacts to the EMAs after the cross, whether they become resistance, or whether price quickly reclaims them and invalidates the bearish alignment.
Important: 50/200 crossovers tend to be more reliable when they occur after clear trending phases and with clean separation between the averages. In range-bound conditions, they are more prone to whipsaws, where the averages cross and then cross back as price chops sideways.
What to Look For Before Acting
Do not assume the crossover guarantees further downside. Consider these factors:
✅ Whether XAU/USD can hold below the 200 EMA (~4340.71) on subsequent daily closes (moving average “rejection” behavior)
✅ Whether rallies stall in the 4300–4350 zone, which has recently acted as a key pivot area
✅ A clean break and close below the 4000 psychological level, versus repeated rebounds from that area
✅ How price reacts to the late-June swing-low region near 3959–3966 (support durability vs. breakdown)
✅ Evidence of lower highs continuing on daily structure (e.g., failures near 4195–4203 from early July)
✅ Whether the daily candles show expanding ranges on down days (momentum) versus shrinking ranges (loss of pressure)
✅ Confirmation on the Weekly timeframe (trend alignment), since the current signal is on 1D
✅ Any shift in macro drivers that often influence XAU/USD (real yields, USD strength, and broad risk sentiment)
Risk Considerations
⚠️ Whipsaw risk: if price remains range-bound around 4000–4350, the EMAs can cross back and forth without a durable trend
⚠️ Lagging signal risk: the crossover comes after a sizable decline from the April highs, increasing the chance of late confirmation
⚠️ Support snapback risk: repeated defenses near ~3960–4000 can trigger sharp counter-trend rallies that run back toward the moving averages
⚠️ Event risk: major data/central bank shifts can overwhelm technical levels and cause gap-like moves on daily candles
Potential Next Steps
Add XAU/USD to a watchlist for how price behaves around 4000 support and the 4300–4350 resistance/EMA zone.
Price is trying to stabilize near 4,000-4,100, but the broader structure stays pressured while it trades below 4,335-4,400.
The next major upside resistance sits around 4,600, followed by 4,800, while deeper support is visible near 3,250-3,300.
Buyers still need to prove strength by reclaiming the moving averages. Sellers remain in control unless price can close back above 4,400.
Trade Idea: Bullish Continuation Scenario
Setup
The bullish setup depends on XAU/USD holding the 4,000-4,100 support area and then reclaiming the EMA resistance cluster around 4,335-4,400.
A daily close above 4,400 would show buyers have pushed price back above both the EMA 50 at 4,335.79 and the EMA 200 at 4,334.89, improving the short-term structure and opening the door for a move toward 4,600 and then 4,800.
Entry
Consider entering long on a daily close above 4,400, confirming that buyers are breaking out of the recent structure.
Alternatively, enter on a controlled pullback into 4,000-4,100 if price stabilizes there and turns back higher.
If price loses that support zone and closes decisively below 4,000, stand aside and wait for either deeper support to form or a cleaner breakout later.
Stop Loss
For breakout entries: stop on a daily close back below 4,335-4,400. That would invalidate the breakout by showing price could not stay above the former ceiling.
For pullback entries: stop on a daily close below 4,000. That would invalidate the support-hold idea and show buyers are no longer defending the zone.
Take Profit
Target 4,800, because that is the next clear upside area on the chart and the most natural place for price to retest if the current recovery continues.
Bottom Line
The bullish case improves only if XAU/USD can reclaim 4,400 and hold above the EMA cluster at 4,335-4,400. That would suggest buyers are regaining control after defending the 4,000-4,100 support area.
The main upside target is 4,800, with 4,600 acting as a possible interim resistance zone. The bullish idea weakens quickly if price closes back below 4,000.
Trade Idea: Bearish Pullback Scenario
Setup
The bearish setup remains valid while XAU/USD trades below the EMA 50 at 4,335.79 and the EMA 200 at 4,334.89.
The 4,335-4,400 area is the key resistance zone sellers need to defend. If price fails there and then loses 4,000,
it would confirm that the rebound attempt has failed and that sellers are pushing price toward the next major demand area near 3,250-3,300.
Entry
Consider entering short on a daily close below 4,000, confirming that the support zone has failed.
Alternatively, if price pushes into 4,335-4,400 and prints a clear bearish rejection candle, enter short on the next daily close back below 4,250.
If price instead breaks and closes decisively above 4,600, stand aside, as that would invalidate the bearish pullback idea.
Stop Loss
For breakdown entries: stop on a daily close back above 4,100. That would invalidate the breakdown by showing price has reclaimed the support zone.
For rejection entries near resistance: stop on a daily close above 4,400. That would invalidate the bearish idea by confirming buyers have pushed through resistance.
Take Profit
Target 3,250-3,300, because that is the next major support area below the current structure and the most likely place where buyers would try to step back in.
Bottom Line
The bearish case stays active while XAU/USD remains below 4,335-4,400, especially with both major EMAs sitting directly overhead.
A rejection from that zone would keep sellers in control and increase the risk of another move lower.
A daily close below 4,000 would confirm the breakdown and shift focus toward 3,250-3,300. The bearish idea is invalidated if price reclaims 4,600 with strength.
This content is strictly for informational purposes only and does not constitute as investment advice. Trading any financial market involves risk. Please read our Risk Disclosure to make sure you understand the risks involved.