


CAD/JPY is showing an early bullish momentum shift after a bearish stretch that pushed price to fresh lower swing lows.
The latest move suggests downside pressure may be starting to ease, but price is now approaching a nearby resistance zone.
Traders may want to see stronger confirmation before treating this corrective bounce as the start of a broader recovery.
Welcome to “TA Alert of the Day.” Each day after the market close, MarketMilk scans for popular technical indicator alerts. We use these alerts as the basis for a mini-lesson, breaking down what each alert means, why it matters, and how traders might interpret it. The goal is to help beginner traders not only spot these alerts but also understand the logic behind them and how they can inform trading decisions.
What MarketMilk Has Detected
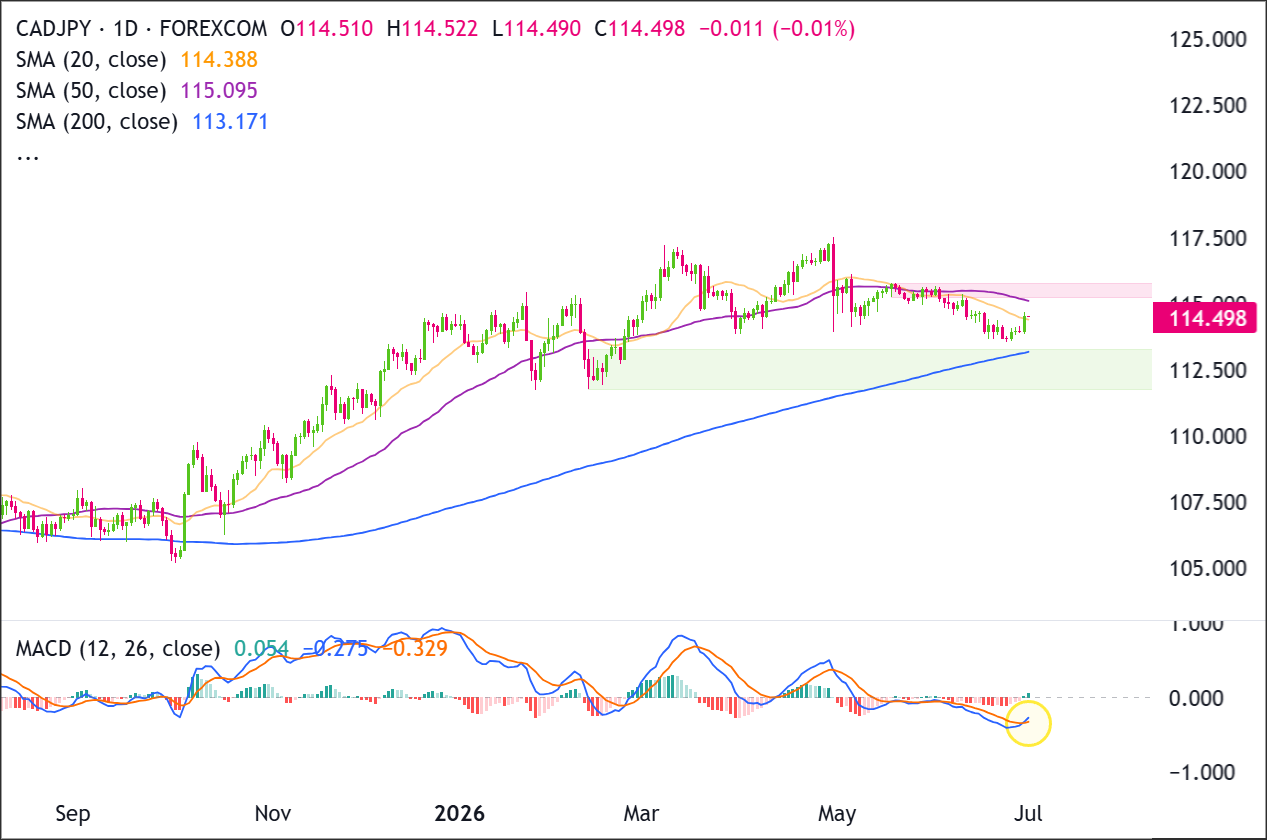
The daily MACD has crossed above its signal line, shifting the histogram into slightly positive territory.
This suggests downside momentum is easing after the recent downswing, though traders may look to the price chart for signs that buyers are actually gaining control.
What This Signals
Traditionally, a bullish MACD cross suggests that downside momentum is fading and that buyers are beginning to regain control.
If the move continues, it could attract traders looking for signs that the recent decline is shifting into a recovery phase.
That case would become stronger if price starts forming higher highs and higher lows from the mid-June base.
However, this same pattern can also point to a counter-trend bounce within a broader downtrend, which means not every bullish signal marks a true reversal.Because the cross is occurring while the MACD remains below zero, it sometimes coincides with situations where prices briefly rebound into resistance (a “bull trap”) before the larger downtrend resumes.
The outcome depends heavily on follow-through price action, how CAD/JPY behaves around nearby resistance bands (notably 114.65–115.20), and whether momentum can continue improving without immediately rolling over.
How It Works
The MACD (Moving Average Convergence Divergence) measures momentum by comparing two exponential moving averages (typically 12- and 26-period EMAs).
The “MACD line” is the difference between those EMAs, while the “signal line” is usually a 9-period EMA of the MACD line.
A bullish signal occurs when the MACD line crosses above the signal line, indicating that recent price action is strengthening relative to the longer lookback.
Because MACD is derived from moving averages, it is inherently lagging: it confirms a shift after it begins rather than predicting it in advance.
Traders often combine the cross with structural price levels (support/resistance) to judge whether the momentum shift is likely to translate into a more durable move.
Important: MACD crosses can whipsaw during range-bound conditions. Reliability tends to improve when the cross aligns with a clear break of resistance, improving risk sentiment, or a move back above key moving averages.
What to Look For Before Acting
Do not assume CAD/JPY will continue higher. Consider these factors:
✅ A daily close holding above 114.65–114.95 (recent pivot zone) rather than rejecting it
✅ Price forming a higher low above the mid-June base near 113.65–113.95
✅ Follow-through toward and through 115.15–115.60 (prior congestion in late May/early June)
✅ The MACD histogram staying positive for multiple sessions (reduces immediate whipsaw risk)
✅ Improvement on the 4-Hour chart (structure turning up) without the daily signal stalling
✅ Lack of sharp rejection wicks near resistance (signs supply is still active overhead)
✅ Broader risk sentiment staying supportive (JPY pairs can be sensitive to risk-off swings)
✅ Awareness of upcoming Canada/Japan macro catalysts (rates/inflation/jobs) that could disrupt technical setups
Risk Considerations
⚠️ Whipsaw risk: MACD crosses frequently fail in sideways markets, especially after extended consolidation
⚠️ Below-zero MACD: A bullish MACD cross below zero may be corrective, meaning it could be a temporary bounce rather than the start of a true trend reversal.
⚠️ Overhead resistance from the prior breakdown zone around 114.65–115.60 may cap rallies
⚠️ Event risk: FX can spike around data/central-bank headlines, invalidating indicator signals quickly
Potential Next Steps
Consider placing CAD/JPY on a watchlist and tracking whether price can hold above nearby resistance while forming a higher-low structure.
Recent price action shows a rebound from the 113.00-113.30 area, with buyers attempting to stabilize above 114.40.
However, price remains capped below the 115.00-115.70 supply zone, where sellers previously stepped in.
Buyers need a daily close above 115.70 to regain control, while sellers need a close back below 113.00 to confirm the recovery attempt has failed.
Trade Idea: Bullish Continuation Scenario
Setup
The bullish setup depends on CAD/JPY holding the 113.00-113.30 support area and pushing back through the 115.00-115.70 resistance zone.
A clean breakout above 115.70 would suggest buyers have absorbed the recent selling pressure and are attempting to resume the broader upward structure toward the prior highs.
Entry
Consider entering long on a daily close above 115.70, confirming that buyers are breaking out of the recent structure.
Alternatively, enter on a controlled pullback into 113.00-113.30 if price stabilizes there and turns back higher.
If price loses that support zone and closes decisively below 113.00, stand aside and wait for either deeper support to form or a cleaner breakout later.
Stop Loss
For breakout entries: stop on a daily close back below 115.00. That would invalidate the breakout by showing price could not stay above the former ceiling.
For pullback entries: stop on a daily close below 113.00. That would invalidate the support-hold idea and show buyers are no longer defending the zone.
Take Profit
Target 117.30-117.50, because that is the next clear upside area on the chart and the most natural place for price to retest if the current recovery continues.
Bottom Line
The bullish case improves only if CAD/JPY closes above 115.70 and turns the 115.00-115.70 resistance zone into support. That would open the door for a move back toward 117.30-117.50.
The bullish idea weakens if price fails to hold 113.00-113.30. A daily close below 113.00 would suggest buyers have lost control of the support area.
Trade Idea: Bearish Pullback Scenario
Setup
The bearish setup is based on CAD/JPY failing below the 115.00-115.70 resistance zone and rolling back toward support.
Sellers would gain more control if price closes below 113.00, as that would break the recent rebound structure and place price back below the key demand area near the rising 200 SMA.
Entry
Consider entering short on a daily close below 113.00, confirming that the support zone has failed.
Alternatively, if price pushes into 115.00-115.70 and prints a clear bearish rejection candle, enter short on the next daily close back below 115.00.
If price instead breaks and closes decisively above 115.70, stand aside, as that would invalidate the bearish pullback idea.
Stop Loss
For breakdown entries: stop on a daily close back above 113.30. That would invalidate the breakdown by showing price has reclaimed the support zone.
For rejection entries near resistance: stop on a daily close above 115.70. That would invalidate the bearish idea by confirming buyers have pushed through resistance.
Take Profit
Target 110.00-110.50, because that is the next major support area below the current structure and the most likely place where buyers would try to step back in.
Bottom Line
The bearish case remains valid if CAD/JPY fails below 115.00-115.70 and then closes below 113.00.
That would confirm sellers have broken the current support structure and could pressure price toward 110.00-110.50.
The bearish idea is invalidated on a decisive daily close above 115.70. A move above that level would show buyers have cleared resistance and shifted momentum back toward the prior highs.
This content is strictly for informational purposes only and does not constitute as investment advice. Trading any financial market involves risk. Please read our Risk Disclosure to make sure you understand the risks involved.


