





BTC/USD has broken above its recent trading range, with buyers pushing price sharply higher and beyond the upper Keltner Channel.
The move shows that bullish momentum has picked up, but price is also becoming stretched in the short term.
RSI has climbed into overbought territory, so traders will want to see whether buyers can keep the breakout going or whether bitcoin needs to pause and pull back first.
The key question now is whether BTC/USD can stay above its former range and continue making higher highs.
Welcome to “TA Alert of the Day.” Each day after the market close, MarketMilk scans for popular technical indicator alerts. We use these alerts as the basis for a mini-lesson, breaking down what each alert means, why it matters, and how traders might interpret it. The goal is to help beginner traders not only spot these alerts but also understand the logic behind them and how they can inform trading decisions.
What MarketMilk Has Detected
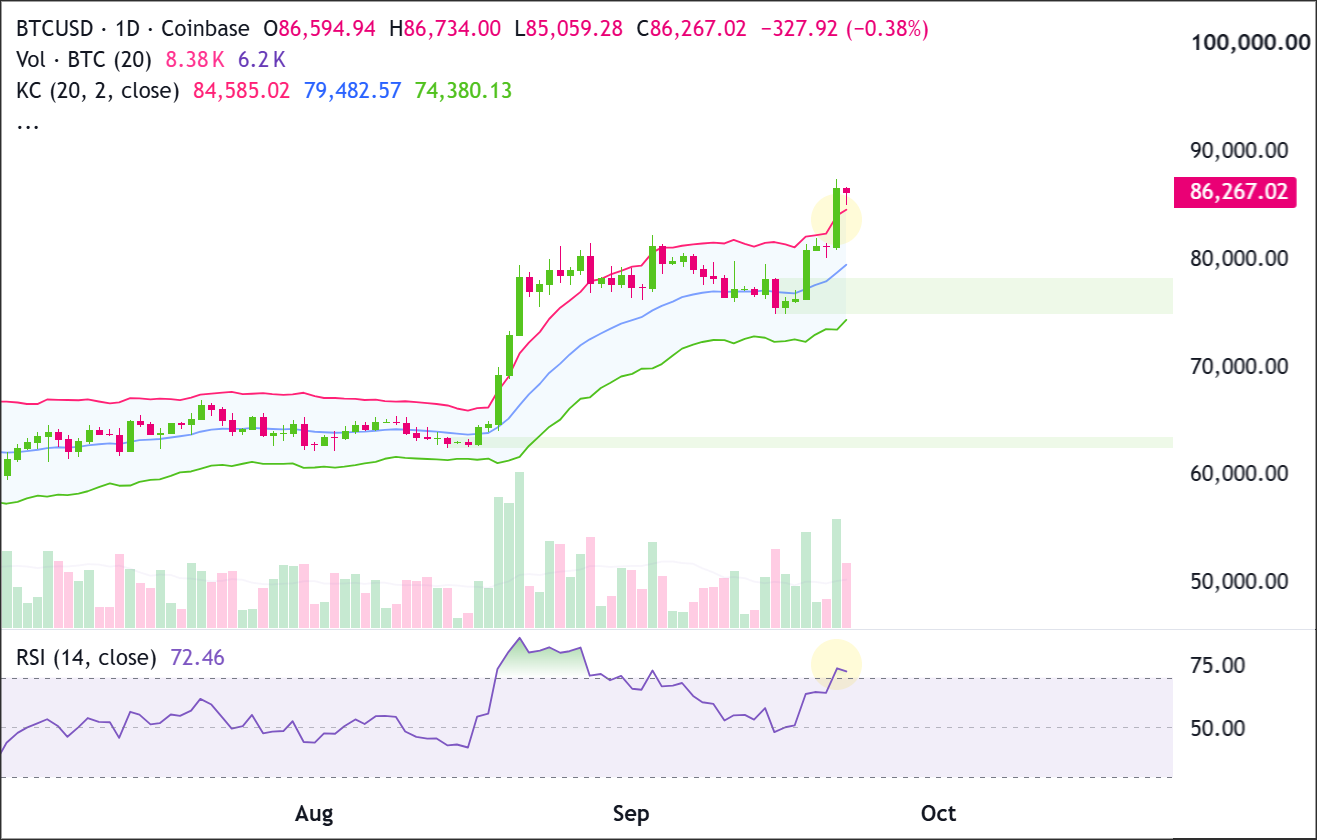
BTC/USD has pushed above the upper Keltner Channel on the daily chart, showing that buying momentum has picked up and price is moving beyond its recent normal range.
The upper Keltner Channel is currently around $84,585, while BTC/USD has pushed as high as roughly $86,700. This means price has moved outside the upper edge of its recent volatility range.
RSI has climbed to 72, putting the indicator into overbought territory and confirming that buying momentum has strengthened considerably.
What This Signals
A move above the upper Keltner Channel usually shows that buying momentum is unusually strong.
In this case, the signal is more notable because BTC/USD is not simply moving above the channel while trading sideways. Price has also broken above its recent range, giving the move support from the underlying price action.
When a range breakout and an upper Keltner Channel breach happen together, it can be a sign that buyers are taking control and price is entering a stronger momentum phase.There is another side to the signal. BTC/USD is now trading well above the Keltner Channel’s middle line near $79,483, while RSI has reached 72. This shows strong momentum, but it also means price is becoming stretched.
An overbought RSI doesn’t automatically mean BTC/USD will reverse. Strong trends can remain overbought for some time. It does mean traders should pay closer attention to whether buyers continue following through after the breakout.
The key now is whether BTC/USD can stay above the former range instead of quickly falling back inside it.
How It Works
The Keltner Channel is a volatility indicator built around a moving average.
A middle line tracks the broader direction of price, while an upper and lower band expand or contract based on recent volatility. On this chart, the Keltner Channel sits around:
- Upper channel: $84,585
- Middle line: $79,483
- Lower channel: $74,380
When price moves above the upper channel, it tells traders that the market is moving higher with more strength than usual.
This can happen during the early stages of a strong breakout, but it can also happen when price has moved too far too quickly. This is why the surrounding price structure matters.
Here, BTC/USD has also broken above the recent $76,000-$81,500 range, which gives the upper-channel breach more significance.
RSI provides another way to judge momentum. RSI moves between 0 and 100, with readings above 70 commonly considered overbought.
BTC/USD’s RSI reading of 72 shows that buying pressure has become strong. Overbought does not necessarily mean “time to sell.” In a strong breakout, RSI can remain above 70 while price continues climbing.
Important: A breach of the upper Keltner Channel does not guarantee that BTC/USD will continue higher. The signal becomes more useful when price also breaks an important resistance area and then holds above it. This is what traders will want to see after the recent move through approximately $81,500.
What to Look For Before Acting
Consider watching these factors over the next few daily candles:
✅ Whether BTC/USD can remain above the former range ceiling around $81,500.
✅ Whether buyers can push price through $86,700-$87,000, which would extend the current breakout.
✅ Whether pullbacks continue forming above $81,500, showing that buyers are stepping in at higher prices.
✅ Whether the area around $84,500 begins acting as short-term support after the upper Keltner Channel breach.
✅ Whether RSI can stay relatively strong instead of immediately falling away from 72.
✅ Whether pullbacks produce smaller bearish candles or quick rebounds rather than aggressive selling.
✅ Whether the green demand zone around $75,500-$78,000 continues to hold if BTC/USD experiences a deeper retracement.
✅ Whether price can eventually clear $90,000, which would keep the door open for a larger move toward $98,000.
Risk Considerations
⚠️ False breakout risk: BTC/USD could fall back below $81,500 and return to its previous trading range if buyers fail to follow through.
⚠️ Overbought momentum: RSI at 72.46 shows strong buying pressure, but it also means the market has already moved considerably in a short period.
⚠️ Price is extended: BTC/USD is trading above the upper Keltner Channel near $84,585, increasing the possibility of a pullback toward the channel before another move higher.
⚠️ Nearby short-term resistance: The recent high around $86,700-$87,000 could slow the advance if buyers cannot push through it.
⚠️ Larger pullback risk: If the breakout fails completely, the green demand zone around $75,500-$78,000 becomes an important area to watch.
Potential Next Steps
Add BTC/USD to a watchlist and watch whether the recent breakout can continue after price pushed above its recent trading range.
Buyers have clearly gained momentum, with price breaching the upper Keltner Channel near $84,585 and RSI reaching an overbought reading of 72.46.
The move is strong, but BTC/USD is also stretched enough that a short-term pullback would not be surprising.
Technical Analysis
BTC/USD has moved into a stronger bullish structure after breaking above its recent $76,000-$81,500 trading range.
Price has also breached the upper Keltner Channel near $84,585, while the middle channel sits around $79,483. This shows that the current move has strong momentum behind it.
RSI has reached 72, putting it into overbought territory. This supports the strength of the move but also raises the possibility of a short-term pause or pullback.
The nearest green demand zone sits around $75,500-$78,000. A deeper demand zone can be seen around $60,500-$63,000.
Price is now starting to pause around $86,700-$87,000 after becoming extended above the upper Keltner Channel. This makes follow-through important.
For buyers, the next sign of strength would be a sustained move above $86,700-$87,000. Sellers would need to push BTC/USD back below $81,500 to raise meaningful doubts about the breakout.
Trade Idea: Bullish Continuation Scenario
Setup
The bullish setup is based on BTC/USD successfully breaking above the recent $81,500 range ceiling while also breaching the upper Keltner Channel near $84,585.
Ideally, the broader $81,500-$84,500 area now acts as support if price pulls back.
A daily close above $87,000 would provide additional confirmation that buyers remain in control and the breakout is continuing.
Entry
Consider entering long on a daily close above $87,000, confirming that buyers are breaking out of the recent structure.
Alternatively, enter on a controlled pullback into $81,500-$84,500 if price stabilizes there and turns back higher.
If price loses that support zone and closes decisively below $81,500, stand aside and wait for either deeper support to form or a cleaner breakout later.
Stop Loss
For breakout entries: stop on a daily close back below $84,500. This would invalidate the breakout by showing price could not stay above the former ceiling and upper Keltner Channel area.
For pullback entries: stop on a daily close below $81,500. This would invalidate the support-hold idea and show buyers are no longer defending the breakout zone.
Take Profit
Use $90,000 as the first upside area to watch because it is the next major round-number level above the current price.
If BTC/USD reaches $90,000 and continues making higher highs, consider trailing the stop higher instead of closing the entire position.
This would give the trade room to continue toward $98,000, which is near the high for the current year.
Bottom Line
The bullish case remains strongest while BTC/USD stays above the former $81,500 range ceiling. A daily close above $87,000 would suggest the breakout still has momentum, with $90,000 becoming the first area to watch.
If buyers keep control beyond $90,000, trailing the stop could allow the trade to continue toward $98,000. A decisive daily close below $81,500 would invalidate the near-term bullish continuation setup.
Trade Idea: Bearish Pullback Scenario
Setup
The bearish setup would begin to develop if BTC/USD struggles around $86,700-$87,000 and starts falling back toward the previous trading range.
The combination of price trading above the upper Keltner Channel near $84,585 and RSI sitting at 72.46 means the market is stretched enough for a pullback to become possible.
The first important warning would be a move back below $84,500. Sellers would gain much stronger control if price then breaks below $81,500.
Entry
Consider entering short on a daily close below $81,500, confirming that the support zone has failed.
Alternatively, if price pushes into $86,700-$87,000 and prints a clear bearish rejection candle, enter short on the next daily close back below $84,500.
If price instead breaks and closes decisively above $87,000, stand aside, as that would invalidate the bearish pullback idea.
Stop Loss
For breakdown entries: stop on a daily close back above $84,500. This would invalidate the breakdown by showing price has reclaimed the failed support area.
For rejection entries near resistance: stop on a daily close above $87,000. This would invalidate the bearish idea by confirming buyers have pushed through resistance.
Take Profit
Target $75,500-$78,000, because that is the next major green demand zone below the current structure and the most likely place where buyers would try to step back in.
Bottom Line
The bearish case would become more interesting if BTC/USD rejects $86,700-$87,000 and falls back below $84,500.
A daily close below $81,500 would provide stronger confirmation that the breakout is failing and could expose the $75,500-$78,000 demand zone.
A decisive close above $87,000 would invalidate the bearish pullback setup.
This content is strictly for informational purposes only and does not constitute as investment advice. Trading any financial market involves risk. Please read our Risk Disclosure to make sure you understand the risks involved.



