


NZD/USD has just printed a classic moving-average crossover that many trend followers watch for confirmation of a momentum shift.
With price now pressing back toward recent lows, traders may be watching to see whether selling pressure can stay organized.
As always with moving averages, confirmation matters as much as the crossover itself.
Welcome to “TA Alert of the Day.” Each day after the market close, MarketMilk scans for popular technical indicator alerts. We use these alerts as the basis for a mini-lesson, breaking down what each alert means, why it matters, and how traders might interpret it. The goal is to help beginner traders not only spot these alerts but also understand the logic behind them and how they can inform trading decisions.
What MarketMilk Has Detected
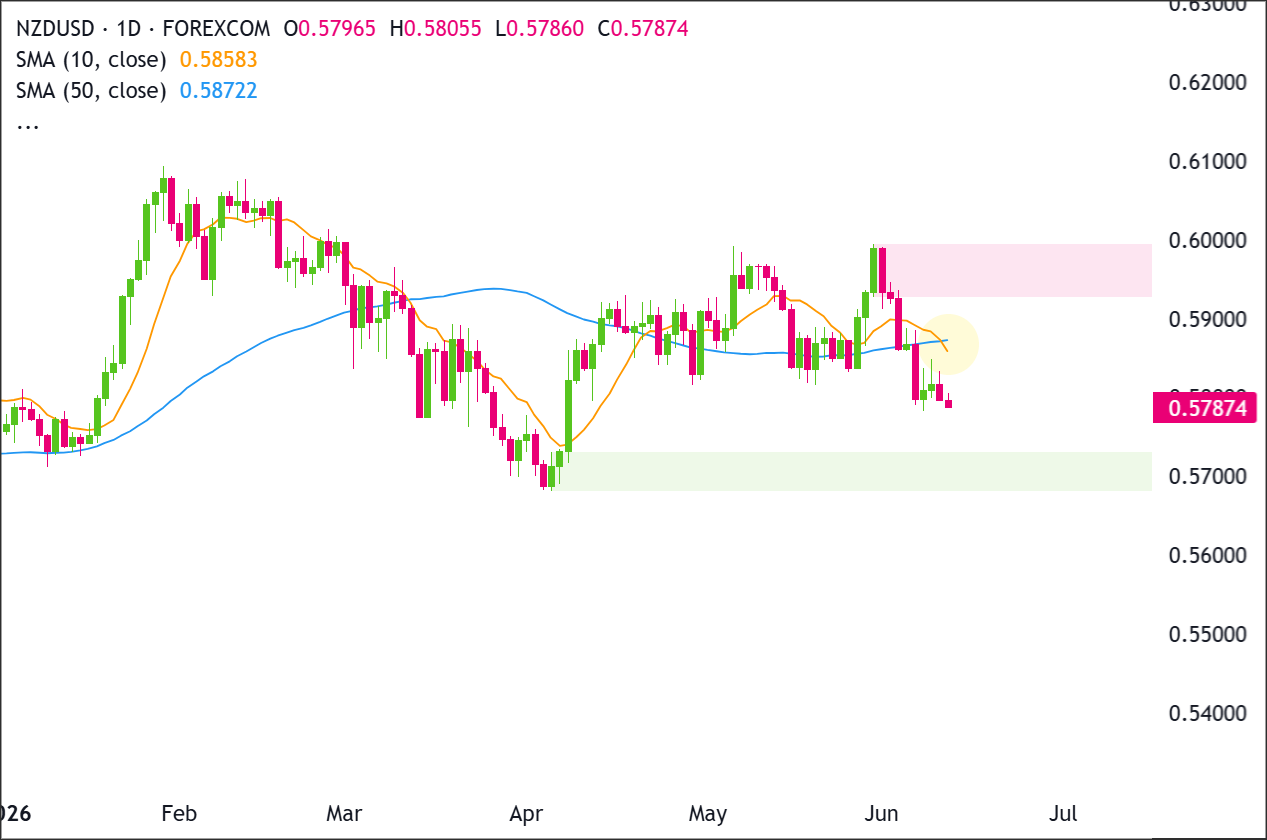
MarketMilk detected a bearish crossover on the daily chart: the 20 SMA has crossed below the 100 SMA.
This occurs as NZD/USD closes at 0.579675, extending the recent downswing from late-May/early-June levels.
Price has repeatedly reacted around the 0.587–0.590 area (a congestion/inflection zone), while downside probes have been frequent into the 0.579–0.580 region and lower.
What This Signals
Traditionally, a 20/100 SMA bearish crossover suggests that recent price action is weakening relative to the longer baseline trend.
If the move is sustained, it can attract trend-following participation and often marks a period where rallies into moving-average zones meet increased supply.
In practical terms, traders commonly watch whether pullbacks stall near the SMAs (now clustered in the 0.587 area) and whether price can keep printing lower highs.However, this same pattern can also represent a lagging confirmation after a decline has already occurred, which can raise the risk of a whipsaw if NZD/USD snaps back into the prior range.
In choppy markets, moving-average crosses sometimes coincide with late-cycle selling where prices briefly break down and then mean-revert upward, especially if support near 0.575–0.580 continues to attract buyers.
Alternatively, if NZD/USD stabilizes and reclaims the 0.587–0.590 area, the crossover may end up being a false bearish confirmation rather than the start of a persistent downtrend.
That type of outcome is more common when the cross happens with limited follow-through and price quickly starts closing back above the faster average.
The outcome depends heavily on trend context, follow-through closes on the daily timeframe, and how price behaves around nearby support/resistance.
Context and confirmation are essential, particularly because the 20 and 100 SMAs were relatively close together into the signal, which can increase sensitivity to short-term swings.
How It Works
A Simple Moving Average (SMA) gives equal weight to all prices in the selected period. The 20 SMA reacts faster to short-term changes, while the 100 SMA reflects the broader trend.
When the 20 SMA crosses below the 100 EMA, it indicates that short-term momentum has weakened enough to slip beneath the longer-term trend.
Because moving averages are derived from past prices, crossovers are inherently lagging: they confirm that a shift has already been underway rather than forecasting a turn.
That’s why traders often combine the crossover with structure (higher highs/lower lows), key levels, and evidence of sustained acceptance below/above the averages.
Important: SMA crossovers can be less reliable in sideways conditions and can produce multiple false signals when price oscillates around the averages. Reliability often improves when the crossover aligns with a clear break of support (or resistance), and when subsequent candles show follow-through rather than immediate snapback.
What to Look For Before Acting
Do not assume the crossover guarantees a sustained downtrend. Consider these factors:
✅ Daily closes holding below the 20 EMA (and ideally below the 100 EMA) rather than immediately reclaiming them
✅ Evidence of lower highs forming on rebounds, especially beneath the 0.587–0.590 congestion zone
✅ A clean break and acceptance below the 0.579–0.580 area, with follow-through toward 0.575 and then 0.572
✅ Rejection wicks or stalled candles when price tests the SMAs from below (a common “trend retest” behavior)
✅ Whether the late-May rally highs near 0.598–0.599 remain a clear swing cap (keeps the broader structure bearish)
✅ Check the Weekly chart for alignment (trend direction and whether price is near multi-week support)
✅ Confirmation from USD-related drivers (e.g., broad USD strength/weakness) rather than NZD/USD moving in isolation
✅ Upcoming macro catalysts (central bank commentary, inflation/labor data) that could override technical follow-through
Risk Considerations
⚠️ Whipsaw risk: if NZD/USD is range-bound, the 20/100 cross can quickly reverse
⚠️ Lag risk: the crossover may occur after much of the downswing has already played out
⚠️ Support bounce risk: repeated reactions around 0.575–0.580 can trigger sharp counter-trend rebounds
⚠️ Event risk: scheduled macro releases can cause gap-like moves on daily candles and invalidate technical setups
Potential Next Steps
Consider keeping NZD/USD on a watchlist for follow-through after the crossover, rather than treating the cross alone as a complete trade thesis.
Many traders wait for either:
- A break below 0.579–0.580 with sustained closes.
- A pullback into the SMA zone near 0.587 that shows rejection.
Whichever approach you use, define invalidation (for example, a recovery back above the moving averages) and size risk appropriately given daily volatility and the potential for news-driven reversals.
Trade Idea: Bullish Continuation Scenario
Setup
The bullish setup depends on NZD/USD stabilizing above the nearby support area and reclaiming the failed moving average zone around 0.5858-0.5872.
A daily close above 0.5880 would suggest buyers are taking back control and opening the door for a retest of 0.5930-0.5990.
Entry
Consider entering long on a daily close above 0.5880, confirming that buyers are breaking out of the recent structure.
Alternatively, enter on a controlled pullback into 0.5680-0.5730 if price stabilizes there and turns back higher.
If price loses that support zone and closes decisively below 0.5680, stand aside and wait for either deeper support to form or a cleaner breakout later.
Stop Loss
For breakout entries: stop on a daily close back below 0.5858. That would invalidate the breakout by showing price could not stay above the former ceiling.
For pullback entries: stop on a daily close below 0.5680. That would invalidate the support-hold idea and show buyers are no longer defending the zone.
Take Profit
Target 0.6000, because that is the next clear upside area on the chart and the most natural place for price to retest if the current recovery continues.
Bottom Line
The bullish case improves if NZD/USD can reclaim 0.5880 and hold above the moving average cluster near 0.5858-0.5872. That would shift the short-term structure back toward buyers and put 0.5930-0.5990 back in play.
If price can’t reclaim 0.5880, the bullish setup remains weak. A daily close below 0.5680 would invalidate the support-hold idea and suggest buyers have lost control of the broader range.
Trade Idea: Bearish Pullback Scenario
Setup
The bearish setup is already developing after NZD/USD rejected 0.5930-0.5990 and slipped back below 0.5858-0.5872.
Sellers remain in control while price trades below that zone, and a daily close below 0.5780 would confirm fresh downside pressure.
Entry
Consider entering short on a daily close below 0.5780, confirming that the support zone has failed.
Alternatively, if price pushes into 0.5858-0.5872 and prints a clear bearish rejection candle, enter short on the next daily close back below 0.5858.
If price instead breaks and closes decisively above 0.5880, stand aside, as that would invalidate the bearish pullback idea.
Stop Loss
For breakdown entries: stop on a daily close back above 0.5800. That would invalidate the breakdown by showing price has reclaimed the support zone.
For rejection entries near resistance: stop on a daily close above 0.5880. That would invalidate the bearish idea by confirming buyers have pushed through resistance.
Take Profit
Target 0.5680-0.5730, because that is the next major support area below the current structure and the most likely place where buyers would try to step back in.
Bottom Line
The bearish case remains stronger while NZD/USD stays below 0.5858-0.5872. A daily close below 0.5780 would confirm that sellers are extending the move lower and increase the probability of a test of 0.5680-0.5730.
The bearish idea weakens if price reclaims 0.5880 on a daily closing basis. That would show buyers have regained the failed support area and could shift momentum back toward 0.5930-0.5990.
This content is strictly for informational purposes only and does not constitute as investment advice. Trading any financial market involves risk. Please read our Risk Disclosure to make sure you understand the risks involved.


