





AUD/NZD has surged sharply higher after a steady recovery from its August lows, putting bullish momentum firmly in focus.
With the pair now testing a key resistance area, traders will be watching to see whether buyers can sustain the move or whether signs of exhaustion begin to emerge.
Welcome to “TA Alert of the Day.” Each day after the market close, MarketMilk scans for popular technical indicator alerts. We use these alerts as the basis for a mini-lesson, breaking down what each alert means, why it matters, and how traders might interpret it. The goal is to help beginner traders not only spot these alerts but also understand the logic behind them and how they can inform trading decisions.
What MarketMilk Has Detected
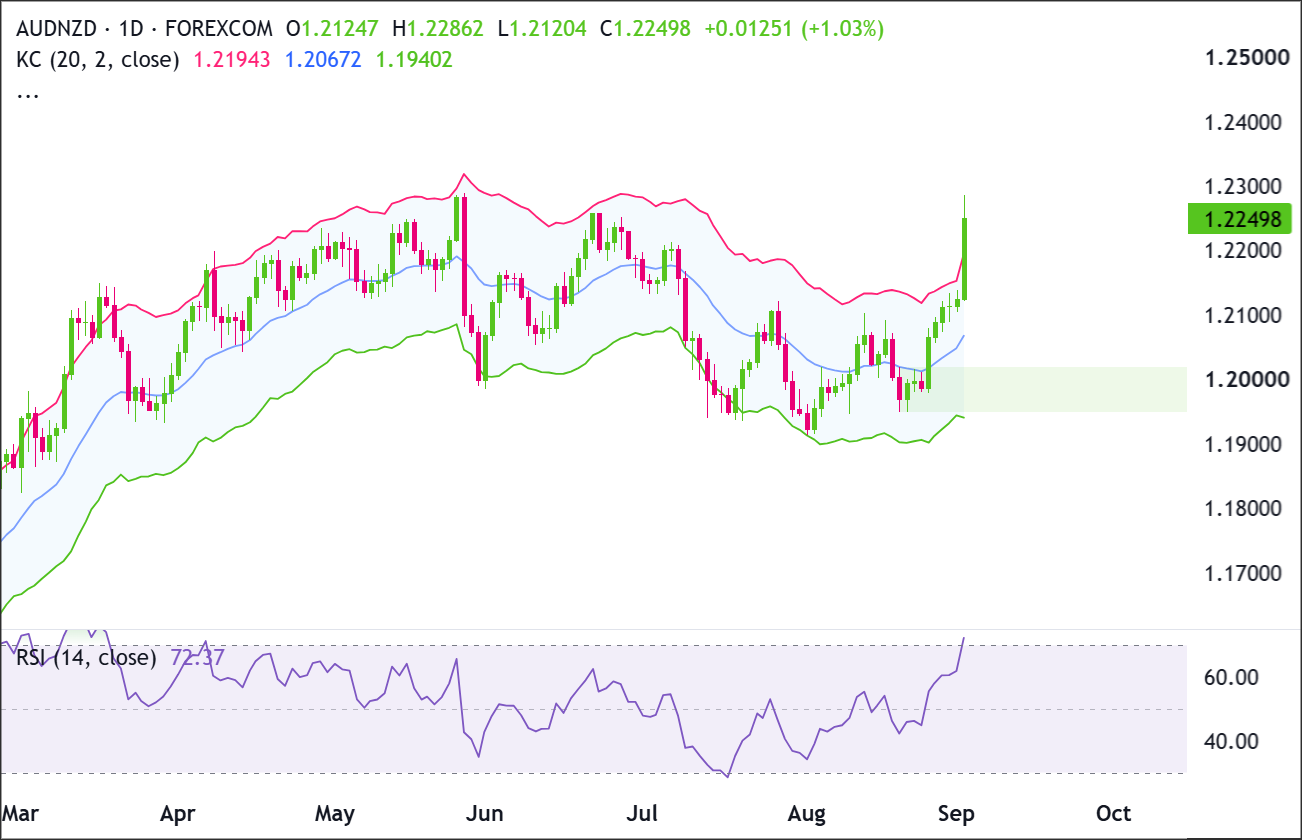
AUD/NZD has closed above its Upper Keltner Channel, showing that the pair is moving more aggressively than usual compared with its recent trading range.
What This Signals
A close above the Upper Keltner Channel can get the attention of traders looking for a possible pullback, especially after a strong run higher.
The move suggests price has risen faster than usual compared with its recent trading range.
Sometimes, this can be a sign that buying momentum is becoming stretched and that buyers may be starting to run out of steam.
Traders will often watch the next few candles to see whether price can hold the breakout or quickly fall back.That said, a move above the upper band doesn’t automatically mean a reversal is coming. It can also be a sign of strong bullish momentum.
During powerful uptrends, price can stay near or above the upper band for several sessions. Traders who try to sell too early can get caught if the rally keeps going.
That’s why the next move matters.
Traders will be looking for either continued buying and higher lows, or signs of rejection such as long upper wicks, failed breakouts, and bearish closes near resistance.
How It Works
Keltner Channels are bands that display above and below a moving average and adjust based on how volatile the market has been.
When price closes above the upper band, it shows that price is moving more strongly than it normally has in recent sessions.
Because the bands expand and contract with volatility, they can help traders spot when price may be getting stretched.
This can sometimes lead to a pullback, but during a strong trend, price can stay near or above the upper band as momentum continues.
Important: A Keltner breach is not a standalone reversal system. Reliability tends to improve when the breach occurs into clearly defined resistance, when subsequent candles show rejection (e.g., long upper wicks, bearish closes), or when broader trend context supports fading an overextended push.
What to Look For Before Acting
Don’t assume a reversal is imminent. Consider these factors:
✅ Whether the next 1–3 daily candles close back inside the channel (a common mean-reversion confirmation)
✅ Signs of rejection near 1.225–1.226 (late-June swing area) such as long upper wicks or bearish daily closes
✅ Whether price holds above the prior breakout zone near 1.211–1.213 (late-August base area) or quickly slips back below it
✅ The slope of the Keltner middle line (around 1.2067 now): rising midline can favor “ride the band” behavior
✅ If the move becomes a wide volatility expansion (large ranges) versus a controlled grind (often healthier for continuation)
✅ Presence of a failed breakout (price trades above recent highs but closes back below them)
✅ Alignment on a higher timeframe: check the Weekly chart for major resistance/supply zones and whether this push is into a larger-range ceiling
✅ Upcoming Australia/New Zealand macro catalysts (rates guidance, inflation/labor releases) that could justify sustained volatility
Risk Considerations
⚠️ Band-riding risk: price can remain above the upper channel longer than expected in a strong trend
⚠️ Whipsaw risk: volatility expansions can reverse quickly, creating false “fade” entries in both directions
⚠️ Resistance not guaranteed: the 1.225–1.226 area may break cleanly if momentum persists
⚠️ Event risk: AUD/NZD can reprice abruptly around central bank communication or surprise data
Potential Next Steps
Keep AUD/NZD on the watchlist after its sharp move higher.
The pair has pushed beyond its usual trading range and is testing an area where previous rallies have stalled.
The next few daily closes could offer important clues about whether buyers have enough momentum to keep the move going or whether the rally is becoming stretched and due for a pullback.
Technical Analysis
AUD/NZD has strengthened considerably, with the latest daily close moving decisively above the upper Keltner Channel.
Momentum is also stretched, with RSI at 72 and above the traditional overbought threshold.
This doesn’t automatically signal a reversal, but combined with the upper Keltner Channel breach it increases the importance of bullish follow-through.
The latest daily candle did show aggressive buying, closing near 1.2250, not far below its 1.2286 high.
This move accelerated price away from the recent August consolidation and brought AUD/NZD directly back into the cluster of highs formed earlier in the year.
Buyers now need to hold above roughly 1.2190–1.2200 and push through 1.2300 to confirm that the breakout has staying power.
A rejection from 1.2250–1.2300, particularly if followed by a move back below 1.2100–1.2130, would instead indicate that the latest rally has failed to establish a higher trading range.
Trade Idea: Bullish Continuation Scenario
Setup
The bullish setup depends on AUD/NZD sustaining its breakout above the upper Keltner Channel and clearing the previous swing-high region around 1.2250–1.2300.
A decisive close above 1.2300 would remove the most obvious overhead resistance visible on the chart and strengthen the case for another leg higher.
On a pullback, buyers should ideally defend 1.2190–1.2200, close to the breached upper Keltner Channel.
Holding this area would suggest former resistance is becoming support. A deeper move below 1.2100 would materially weaken the breakout structure.
Entry
Consider entering long on a daily close above 1.2300, confirming that buyers are breaking out of the recent structure.
Alternatively, enter on a controlled pullback into 1.2190–1.2200 if price stabilizes there and turns back higher.
If price loses this support zone and closes decisively below 1.2100, stand aside and wait for either deeper support to form or a cleaner breakout later.
Stop Loss
For breakout entries: stop on a daily close back below 1.2190. This would invalidate the breakout by showing price could not stay above the former ceiling and breached Keltner Channel boundary.
For pullback entries: stop on a daily close below 1.2100. This would invalidate the support-hold idea and show buyers are no longer defending the zone.
Take Profit
Target 1.2400, because a confirmed break above 1.2300 would leave little visible overhead resistance on the chart, making the next major round-number area a natural upside objective.
Bottom Line
The bullish case strengthens on a sustained daily close above 1.2300.
This would confirm that the upper Keltner Channel breach is developing into genuine trend expansion rather than a temporary overshoot, opening the way toward 1.2400.
A pullback can remain constructive while 1.2190–1.2200 holds as support. A decisive close below 1.2100 would invalidate the near-term bullish setup and suggest the breakout is losing momentum.
Trade Idea: Bearish Pullback Scenario
Setup
The bearish setup centers on a failed breakout from 1.2250–1.2300. AUD/NZD is currently stretched above the upper Keltner Channel at approximately 1.2194, while RSI has moved into overbought territory.
If buyers can’t maintain the expansion, price could rotate back toward the channel and recent support.
Sellers would gain stronger control if price subsequently breaks 1.2100–1.2130.
This would unwind a significant portion of the latest rally and expose the green demand zone around 1.1950–1.2010.
Entry
Consider entering short on a daily close below 1.2100, confirming that the support zone has failed.
Alternatively, if price pushes into 1.2250–1.2300 and prints a clear bearish rejection candle, enter short on the next daily close back below 1.2194.
If price instead breaks and closes decisively above 1.2300, stand aside, as this would invalidate the bearish pullback idea.
Stop Loss
For breakdown entries: stop on a daily close back above 1.2130. This would invalidate the breakdown by showing price has reclaimed the support zone.
For rejection entries near resistance: stop on a daily close above 1.2300. This would invalidate the bearish idea by confirming buyers have pushed through resistance.
Take Profit
Target 1.1950–1.2010, because this green demand zone is the next major support area below the current structure and the most likely place where buyers would try to step back in.
Bottom Line
The bearish case requires AUD/NZD to fail around 1.2250–1.2300 and retreat back beneath the upper Keltner Channel near 1.2194.
A subsequent breakdown below 1.2100 would provide stronger confirmation that the latest upside expansion is unwinding.
If this breakdown develops, 1.1950–1.2010 becomes the primary downside target.
A decisive daily close above 1.2300 would invalidate the bearish pullback scenario and favor continued upside.
This content is strictly for informational purposes only and does not constitute as investment advice. Trading any financial market involves risk. Please read our Risk Disclosure to make sure you understand the risks involved.



