





AUD/NZD has made a sharp downside move, pulling the pair back into a familiar support zone around 1.206–1.208.
The drop suggests short-term selling pressure has intensified, but this area could be where traders start watching for signs of stabilization.
A quick rebound from here may signal a snapback, while continued weakness below support could open the door to further downside.
Welcome to “TA Alert of the Day.” Each day after the market close, MarketMilk scans for popular technical indicator alerts. We use these alerts as the basis for a mini-lesson, breaking down what each alert means, why it matters, and how traders might interpret it. The goal is to help beginner traders not only spot these alerts but also understand the logic behind them and how they can inform trading decisions.
What MarketMilk Has Detected
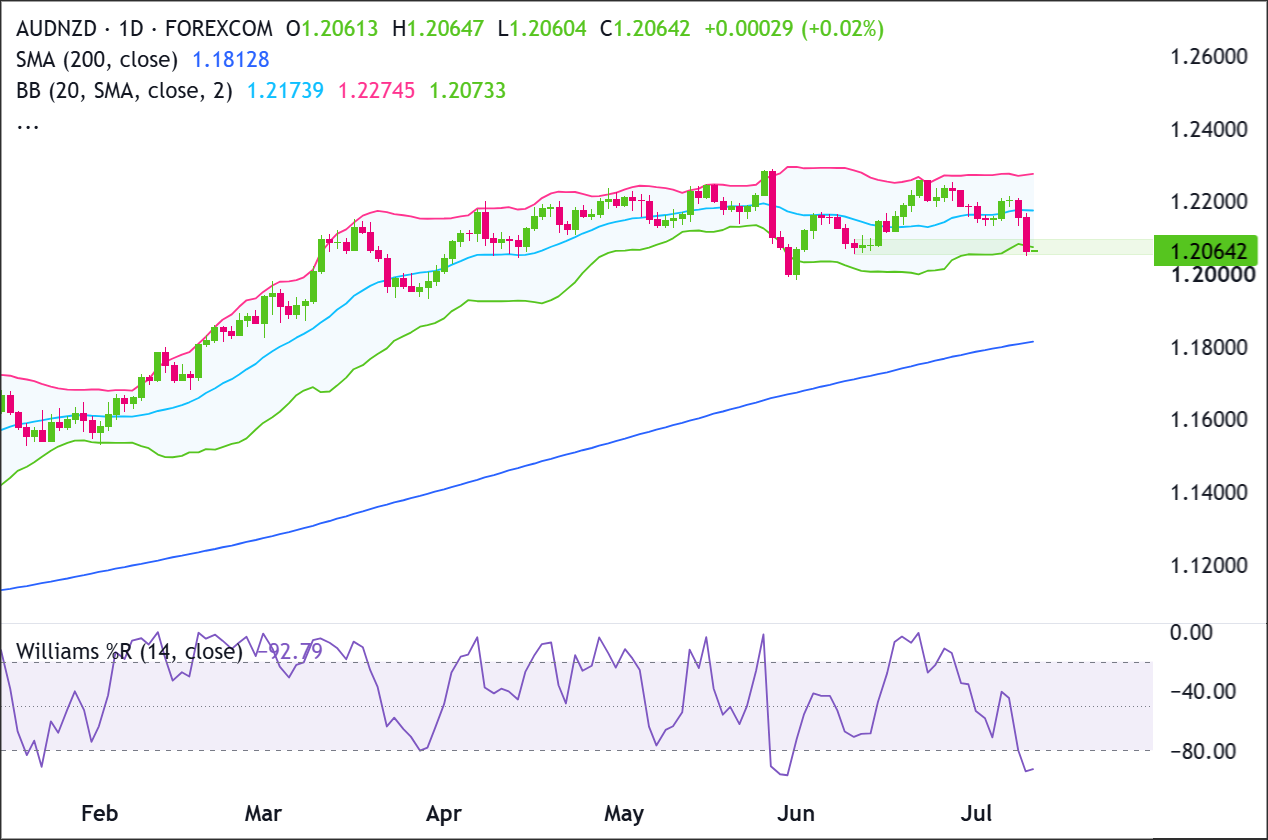
AUD/NZD closed below its lower Bollinger Band on the daily chart, putting the pair outside its recent trading range.
This means the latest close was lower than what would typically be expected based on price action over roughly the past 20 trading days.
The pair has repeatedly rotated around the mid-band region near 1.216–1.218, with several mean-reversion swings since late May’s sharp drop.
The current close is also back near a known demand zone around 1.206–1.208, an area that has been visited multiple times (e.g., early June) after the late-May breakdown.
What This Signals
A close below the lower Bollinger Band can attract traders looking for a potential rebound because the price has moved farther below its recent average than usual.
If the move is sustained back inside the bands, it often marks a transition from “sell pressure” to “stabilization,” especially when it occurs near prior support zones (here, the 1.206–1.208 region).
However, this same pattern can also represent trend acceleration rather than exhaustion. In downside phases, price can “walk the band,” where closes keep printing near or below the lower band as volatility expands.That failure mode is especially relevant here because the break occurred after a quick drop from the recent swing area near 1.2200–1.2253 (late June), suggesting sellers may be reasserting control if follow-through appears.
Alternatively, the dip under the band can be a bear trap where prices briefly flush below a watched volatility boundary and then rebound sharply, forcing late sellers to cover.
In that case, the mid-band area near 1.2174 becomes a natural “magnet” level traders watch for a reversion attempt, while nearby resistance around 1.2200–1.2235 would be a tougher test if the bounce develops.
The outcome depends heavily on follow-through versus rejection in the next few sessions, the slope of the Bollinger middle band (trend context), and whether volatility is expanding (favoring continuation) or quickly contracting (favoring mean reversion).
How It Works
Bollinger Bands plot a 20-period moving average (the middle band) with an upper and lower band set a chosen number of standard deviations away (here, 2).
Because standard deviation expands and contracts with volatility, the bands adjust dynamically to changing market conditions.
A close below the lower band means price finished the session more than ~2 standard deviations below its 20-day average, an “unusual” event in statistical terms.
This can flag either (1) short-term downside overextension that later mean-reverts, or (2) a volatility expansion phase where the market is transitioning into a stronger directional move.
Important: Bollinger Bands do not provide direction by themselves, only “stretch” versus recent volatility. Signals tend to be more reliable when combined with trend filters (middle-band slope, market structure) and confirmation from subsequent candles.
What to Look For Before Acting
Don’t assume an immediate rebound. Consider these factors:
✅ A daily close back inside the bands (back above ~1.2078) to show rejection of the breakdown
✅ Evidence of support holding around 1.206–1.208 (multiple closes defending, not just an intraday dip)
✅ A bullish follow-through candle (higher close than 1.206045), ideally with reduced downside wick-to-body imbalance
✅ Whether price can reclaim the middle band near 1.2174 over time (a common mean-reversion target)
✅ Reaction around nearby resistance: 1.2200 and the prior swing zone 1.2235–1.2253
✅ If weakness continues, watch for acceptance below 1.205 and whether price starts “walking” the lower band
✅ Confirmation from the Weekly chart structure (trend/levels).
✅ Australia/New Zealand macro catalysts (RBA/RBNZ commentary, CPI/labor data) that can drive multi-day volatility
Risk Considerations
⚠️ Band-walk risk: price can keep closing near/below the lower band during strong sell phases, delaying any mean reversion
⚠️ False reversal risk: an initial bounce can fail near the middle band (~1.217) and roll back over
⚠️ Volatility expansion: breaches often occur when ranges widen, increasing stop-out risk on tight positioning
⚠️ Event risk: data surprises can override technical “stretch” signals and extend the move
Potential Next Steps
Keep AUD/NZD on a watchlist for the next few daily closes to see whether price quickly re-enters the bands or continues to press lower.
Many traders wait for confirmation such as a close back above the lower band and/or a push toward the middle band near 1.217 before treating the move as a mean-reversion setup.
AUD/NZD remains in a broader uptrend above the 200-day SMA near 1.1813, but the short-term structure has weakened after price failed near the 1.2200-1.2275 resistance area.
Recent price action shows a sharp rejection from the 1.2200 area, followed by a heavy move into the lower Bollinger Band around 1.2073.
Momentum is stretched to the downside, so sellers need a clean break below 1.2050 to prove continuation, while buyers need price to stabilize above 1.2050-1.2070 and reclaim 1.2174 to shift control back higher.
Trade Idea: Bullish Continuation Scenario
Setup
The bullish setup depends on AUD/NZD defending the 1.2050-1.2070 support zone near the lower Bollinger Band and turning back higher.
If buyers can hold that area and reclaim the mid Bollinger Band near 1.2174, the recent drop would look more like a pullback within the broader uptrend rather than the start of a deeper reversal.
A stronger bullish confirmation would come on a daily close above 1.2200, opening the door for a retest of 1.2275-1.2300.
Entry
Consider entering long on a daily close above 1.2200, confirming that buyers are breaking out of the recent structure.
Alternatively, enter on a controlled pullback into 1.2050-1.2070 if price stabilizes there and turns back higher.
If price loses that support zone and closes decisively below 1.2050, stand aside and wait for either deeper support to form or a cleaner breakout later.
Stop Loss
For breakout entries: stop on a daily close back below 1.2174. That would invalidate the breakout by showing price could not stay above the former ceiling.
For pullback entries: stop on a daily close below 1.2050. That would invalidate the support-hold idea and show buyers are no longer defending the zone.
Take Profit
Target 1.2275-1.2300, because that is the next clear upside area on the chart and the most natural place for price to retest if the current recovery continues.
Bottom Line
The bullish case improves if AUD/NZD holds 1.2050-1.2070 and reclaims 1.2174, especially with price currently stretched near the lower Bollinger Band.
A daily close above 1.2200 would confirm that buyers are taking back short-term control.
The upside target is 1.2275-1.2300, while the key invalidation level is 1.2050. A daily close below 1.2050 would weaken the bullish continuation idea and suggest the pullback is not finished.
Trade Idea: Bearish Pullback Scenario
Setup
The bearish setup is based on AUD/NZD failing to recover from the lower Bollinger Band area and breaking below nearby support.
The first resistance zone is 1.2174-1.2200, where the mid Bollinger Band and recent breakdown area sit.
If price can’t reclaim that zone and instead closes below 1.2050, sellers would have a stronger case for a continuation move toward 1.2000.
Entry
Consider entering short on a daily close below 1.2050, confirming that the support zone has failed.
Alternatively, if price pushes into 1.2174-1.2200 and prints a clear bearish rejection candle, enter short on the next daily close back below 1.2120.
If price instead breaks and closes decisively above 1.2200, stand aside, as that would invalidate the bearish pullback idea.
Stop Loss
For breakdown entries: stop on a daily close back above 1.2073. That would invalidate the breakdown by showing price has reclaimed the support zone.
For rejection entries near resistance: stop on a daily close above 1.2200. That would invalidate the bearish idea by confirming buyers have pushed through resistance.
Take Profit
Target 1.2000, because that is the next major support area below the current structure and the most likely place where buyers would try to step back in.
Bottom Line
The bearish case stays active if AUD/NZD remains capped below 1.2174-1.2200 and loses 1.2050 on a daily closing basis. That would confirm that sellers have pushed price through the lower Bollinger Band support area.
The downside target is 1.2000, while bearish invalidation sits above 1.2200. A daily close above 1.2200 would weaken the pullback setup and shift focus back toward 1.2275-1.2300.
This content is strictly for informational purposes only and does not constitute as investment advice. Trading any financial market involves risk. Please read our Risk Disclosure to make sure you understand the risks involved.



