





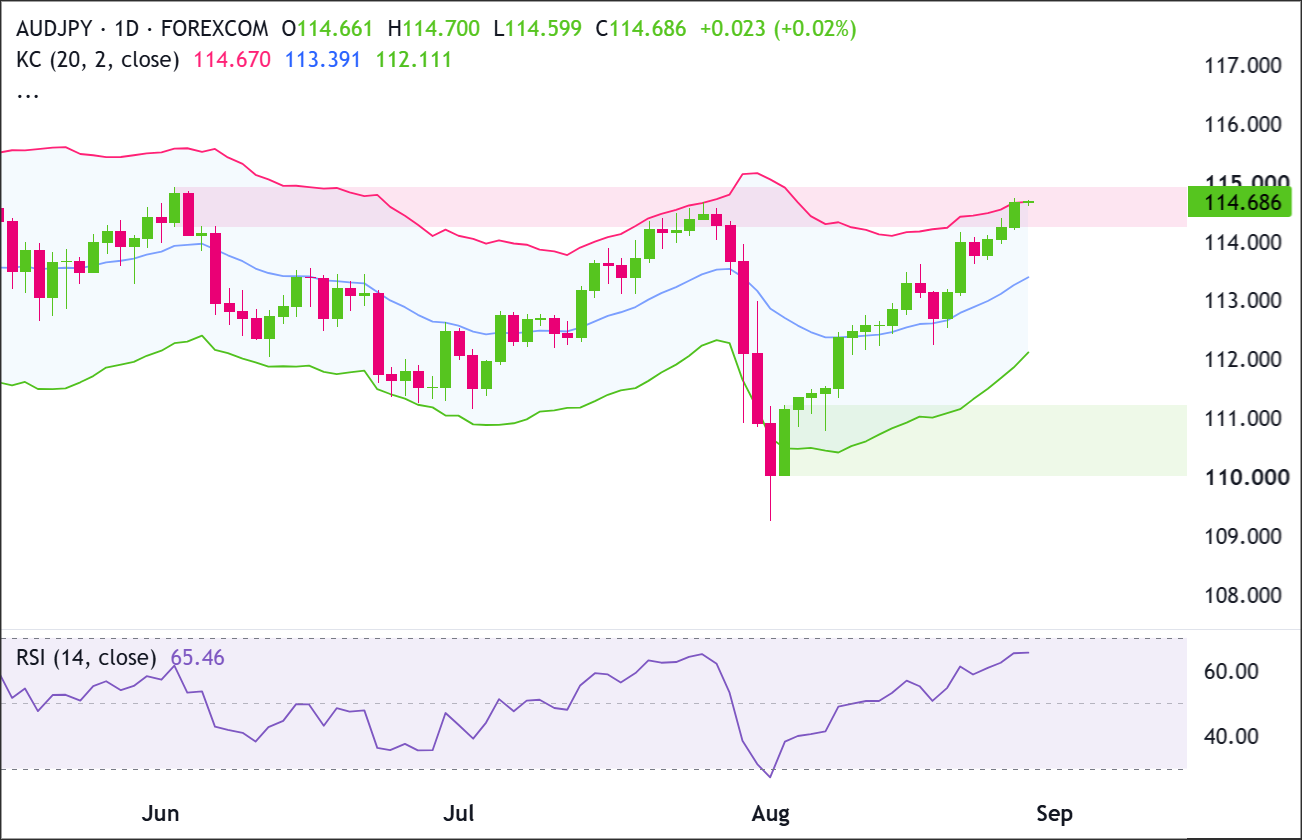
AUD/JPY has rallied from its early-August lows and is now testing key resistance around 114.65–114.90.
The recent move shows buyers are still in control, but price may also be getting a little stretched after the sharp rebound.
The next few sessions could show whether AUD/JPY has enough momentum to keep pushing higher or whether sellers step in and trigger a pullback.
Welcome to “TA Alert of the Day.” Each day after the market close, MarketMilk scans for popular technical indicator alerts. We use these alerts as the basis for a mini-lesson, breaking down what each alert means, why it matters, and how traders might interpret it. The goal is to help beginner traders not only spot these alerts but also understand the logic behind them and how they can inform trading decisions.
What MarketMilk Has Detected
AUD/JPY closed above the upper Keltner Channel, meaning price moved beyond the upper end of its recent volatility range.
What This Signals
A close above the upper Keltner Channel shows that price has moved beyond its recent volatility range. This can signal strong upward momentum, but it can also suggest that the move is becoming stretched.
When this happens near an area where price has struggled before, such as the mid-114s for AUD/JPY, traders may watch for signs that buying momentum is starting to fade or that a pullback could develop.
However, this same pattern can also represent trend strength.In strong upswings, price can “walk the band,” where repeated closes near or above the upper channel sometimes coincide with persistent demand rather than immediate reversal.
If AUD/JPY holds above the breakout area near 114.40–114.50, the signal may read more as continuation than exhaustion.
Alternatively, a quick snap back inside the channel, especially if followed by a lower close, can suggest a short-term bull trap where prices briefly push beyond a well-watched boundary and then revert.
That failure mode tends to be more meaningful if rejection happens near established highs (such as 114.73–114.92) and is accompanied by larger daily ranges.
The outcome depends heavily on trend persistence, where the close prints relative to the channel over the next few sessions, and how price behaves around nearby resistance/support.
How It Works
Keltner Channels are volatility-based bands plotted around an average price (typically an EMA).
The middle line represents the trend baseline (here based on the 20-period setting), while the upper and lower bands expand and contract using a multiple of ATR (average true range), which measures typical price movement.
When price closes above the upper band, it means the market has moved beyond what has recently been “normal” volatility to the upside.
Because the bands are derived from ATR, Keltner Channels are best interpreted as a magnitude tool, not a directional forecast.
A breach highlights expansion and potential extension; it does not, by itself, confirm a reversal or continuation.
Important: Price can stay above a volatility band for several sessions when a strong trend is in place, so a single breach does not necessarily mean a reversal is coming. The signal becomes more meaningful when it happens near a clear resistance level and is followed by signs of rejection, such as a weak close or a move back inside the band.
What to Look For Before Acting
Don’t assume the signal implies an immediate reversal. Consider these factors:
✅ Whether the next 1–3 daily closes move back inside the Keltner Channel (often a key confirmation for mean reversion)
✅ Signs of rejection near resistance at 114.73 and 114.90–114.92 (failed pushes, long upper wicks, weaker closes)
✅ Whether former resistance around 114.40–114.50 holds as support on any pullback
✅ If the Keltner middle line (currently ~113.25) continues rising—supporting an uptrend backdrop despite the “stretch”
✅ Daily range behavior: expanding ranges can confirm volatility expansion; shrinking ranges after a breach can hint at momentum cooling
✅ Market structure: higher highs/higher lows remain intact vs. a break back below recent swing areas around 113.65–113.75
✅ Alignment on a higher timeframe on the Weekly chart (trend direction and proximity to multi-week resistance)
✅ Event risk that can distort AUD/JPY moves (RBA/BoJ communication, inflation/employment releases, shifts in risk sentiment)
Risk Considerations
⚠️ Band-walk risk: price can remain above the upper channel in persistent trends, making early counter-trend entries vulnerable
⚠️ Whipsaw risk: a single close back inside the band may not be enough; choppy follow-through can trigger false reversals
⚠️ Resistance squeeze risk: if 114.73–114.92 breaks cleanly, short-covering can extend the move despite “overextension” signals
⚠️ News risk: AUD/JPY can react sharply to macro headlines, reducing the reliability of purely technical triggers
Potential Next Steps
Keep AUD/JPY on your near-term watchlist as its August recovery moves into an area where buyers could start facing some resistance.
Momentum still looks positive, but the pair is also looking a bit stretched above the upper Keltner Channel and is now trading at a supply zone.
The next few daily candles should give us a better idea of what happens next, whether the rally has enough strength to break higher and keep going, or whether resistance kicks in and leads to a pullback.
Technical Analysis
Price has maintained a sequence of higher lows and higher highs through most of August, with buyers steadily carrying AUD/JPY back toward the prior highs.
Recent candles have continued closing near their upper ranges, but price is now pushing directly into 114.25–114.90, where previous advances stalled.
Buyers need a decisive close above 114.90 to confirm that supply has been absorbed. A rejection followed by a loss of 114.00 would instead suggest that sellers are beginning to regain control.
Trade Idea: Bullish Continuation Scenario
Setup
The bullish setup depends on AUD/JPY converting the current test of 114.25–114.90 supply into a confirmed breakout.
The upper Keltner Channel breach and RSI at 65 support the current momentum, but buyers still need to prove they can hold above the supply-zone ceiling.
With no clear resistance visible above 114.90, a successful breakout could leave price with room to extend higher.
On a pullback, 113.90–114.20 is the key near-term support area that should remain intact to preserve the immediate bullish structure.
Entry
Consider entering long on a daily close above 114.90, confirming that buyers are breaking out of the recent structure.
Alternatively, enter on a controlled pullback into 113.90–114.20 if price stabilizes there and turns back higher.
If price loses that support zone and closes decisively below 113.80, stand aside and wait for either deeper support to form or a cleaner breakout later.
Stop Loss
For breakout entries: begin with a stop on a daily close back below 114.70. That would invalidate the breakout by showing price could not stay above the former ceiling.
If price continues higher after the breakout, trail the stop beneath newly established daily swing lows rather than leaving the initial stop unchanged.
For pullback entries: begin with a stop on a daily close below 113.80. If price subsequently establishes higher swing lows, trail the stop upward beneath those levels to protect gains while allowing the trend room to develop.
Take Profit
Use a trailing stop rather than a fixed profit target. Once AUD/JPY clears 114.90, there is no clearly defined overhead resistance visible on the chart to provide a technically justified upside target.
As price advances, continue raising the stop beneath confirmed higher swing lows. This allows the position to participate in a potentially extended breakout while letting price action determine when the move has run its course.
Bottom Line
The bullish case strengthens on a decisive daily close above 114.90. Such a move would clear the pink supply zone and confirm that the recent upper Keltner Channel breach is developing into sustained upside momentum.
With no obvious resistance above 114.90, the better approach is to trail the stop beneath successive higher swing lows rather than cap the trade with an arbitrary fixed target.
If AUD/JPY instead falls back through 113.90–114.20 and closes below 113.80, the near-term bullish structure would weaken, and the continuation setup should be reassessed.
Trade Idea: Bearish Pullback Scenario
Setup
The bearish scenario depends on the pink supply zone at 114.25–114.90 producing a meaningful rejection after the recent strong advance.
Price is already slightly beyond the upper Keltner Channel, so failure to sustain the move could produce mean reversion.
Sellers would gain stronger confirmation if AUD/JPY falls back below 114.00, with a deeper breakdown opening the possibility of a move toward the larger green demand zone at 110.00–111.20.
Entry
Consider entering short on a daily close below 114.00, confirming that the support zone has failed.
Alternatively, if price pushes into 114.70–114.90 and prints a clear bearish rejection candle, enter short on the next daily close back below 114.25.
If price instead breaks and closes decisively above 114.90, stand aside, as that would invalidate the bearish pullback idea.
Stop Loss
For breakdown entries: stop on a daily close back above 114.25. That would invalidate the breakdown by showing price has reclaimed the support zone.
For rejection entries near resistance: stop on a daily close above 115.00. That would invalidate the bearish idea by confirming buyers have pushed through resistance.
Take Profit
Target 110.00–111.20, because that is the next major demand area below the current structure and the clearest zone where buyers previously stepped in aggressively.
Bottom Line
The bearish case centers on a rejection from 114.25–114.90, particularly after price breached the upper Keltner Channel while approaching established supply.
A daily close below 114.00 would provide the first meaningful evidence that the current rally is losing momentum.
If selling pressure continues, 110.00–111.20 becomes the major downside target. A decisive daily close above 114.90 would invalidate the immediate bearish pullback setup.
This content is strictly for informational purposes only and does not constitute as investment advice. Trading any financial market involves risk. Please read our Risk Disclosure to make sure you understand the risks involved.



