





AUD/CHF has been climbing steadily for several weeks, but the latest price action suggests the rally may be starting to lose some momentum.
With the pair trading near recent highs and showing only a modest pullback so far, the key question is whether buyers can keep control or whether this pause develops into a deeper correction.
How price reacts around nearby support could help reveal whether the broader uptrend still has room to run.
Nearby support levels could become important if sellers begin to gain traction.
Welcome to “TA Alert of the Day.” Each day after the market close, MarketMilk scans for popular technical indicator alerts. We use these alerts as the basis for a mini-lesson, breaking down what each alert means, why it matters, and how traders might interpret it. The goal is to help beginner traders not only spot these alerts but also understand the logic behind them and how they can inform trading decisions.
What MarketMilk Has Detected
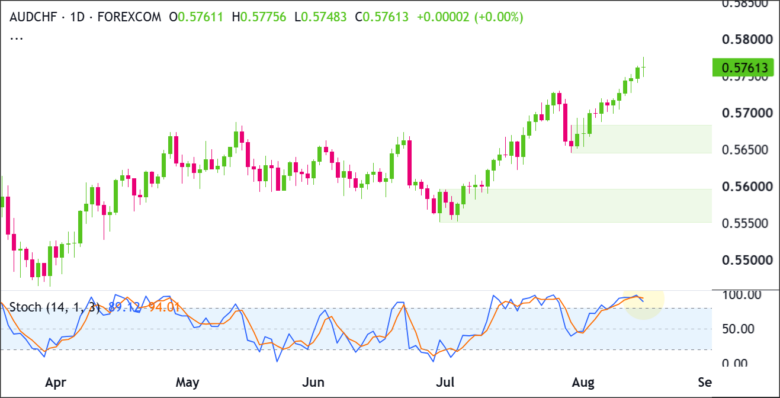
MarketMilk detected a bearish Stochastic (14,3,3) crossover on the daily timeframe, where %K crossed below %D.
Notably, both lines remain in overbought momentum territory (above 80), which often highlights slowing upside momentum rather than an immediate trend change by itself.
What This Signals
A bearish Stochastic crossover while the oscillator is above 80 suggests that upside momentum is decelerating.
If the move is sustained, it could attract mean-reversion sellers and profit-taking, potentially shifting price action from a strong advance into consolidation or a corrective pullback.
However, this same pattern can also represent a routine reset inside a broader uptrend.
In strong uptrends, Stochastic can remain elevated for extended periods, and crossovers can occur where prices briefly dip or move sideways before the trend resumes.
In this scenario, the signal may simply reflect a momentum “cooling” phase rather than a durable reversal.
The outcome depends heavily on follow-through in price action and how AUD/CHF behaves around nearby support zones (0.5727 and 0.5699–0.5713).
And also whether selling pressure is strong enough to push the oscillator out of overbought conditions.
How It Works
The Stochastic oscillator (14,3,3) compares the latest close to the high-low range over the past 14 periods, producing %K (the faster line) and a smoothed signal line %D.
Readings above 80 indicate overbought momentum (strong recent closes near the top of the range), while readings below 20 indicate oversold momentum.
A bearish signal occurs when %K crosses below %D, which can indicate that recent buying pressure is weakening relative to the prior pace.
Because it is a momentum tool, it can be most useful when combined with trend structure, support/resistance, and evidence that price is actually responding to the momentum shift.
Important: Stochastic crossovers can whipsaw during tight consolidations or persistent trends. The reliability typically improves when the crossover is followed by a break of nearby support or a clear change in the sequence of highs/lows.
What to Look For Before Acting
Do NOT assume an immediate reversal lower. Consider these factors:
✅ A daily close back below the 0.5727 area (recent reference support from late July/early August)
✅ A break below the 0.5699–0.5713 zone (cluster of prior highs/closes in late July)
✅ Evidence of a lower high forming on price after the recent push toward 0.5776
✅ Stochastic continuing to roll over, ideally with %K moving down through 80 (showing momentum is exiting the overbought regime)
✅ Bearish candle follow-through (e.g., consecutive lower closes rather than a one-day stall)
✅ Whether pullbacks hold above 0.5659–0.5661 (a prior pivot area from late July/early August); holding could imply consolidation, not reversal
✅ Alignment check on a higher timeframe: does the Weekly chart also show weakening structure/momentum, or is it still trending cleanly?
✅ A catalyst check: upcoming RBA/SNB messaging, inflation/labor data, or broader risk sentiment shifts that could amplify CHF demand
Risk Considerations
⚠️ Trend persistence risk: Stochastic can stay overbought for long periods in an uptrend, producing premature bearish crossovers.
⚠️ Whipsaw risk: If AUD/CHF remains range-bound near highs, %K/%D can cross multiple times without meaningful price follow-through.
⚠️ Nearby support risk: The 0.5713–0.5727 region may attract dip-buying; short entries into support can face abrupt rebounds.
⚠️ Event risk: Macro headlines or central-bank repricing can override oscillator signals quickly, especially in CHF crosses.
Potential Next Steps
Keep AUD/CHF on a watchlist for signs that the recent advance is either extending or beginning to lose steam.
The pair has pushed firmly higher over the past several weeks, but the latest session shows a more balanced contest between buyers and sellers as momentum begins to cool.
The next few daily closes should help determine whether the recovery has enough strength to continue or whether a broader pullback is starting to develop.
New: Currency Converter
Quickly convert between currencies and check exchange rates with our new Currency Converter tool.
Technical Analysis
AUD/CHF remains in a clear short-term uptrend, with price producing a sequence of higher highs and higher lows since early July.
Price has climbed steadily from its early-July low, with successive higher lows supporting the move into a fresh swing high near 0.5776.
However, the latest closed candle formed a long-legged doji showing increased indecision after the recent advance and suggesting buyers and sellers are becoming more evenly matched at current levels.
The long upper and lower wicks show that both buyers and sellers were able to push price significantly during the session, but neither side could maintain control into the close.
After an extended rally, that matters because it can indicate that buyers are no longer dominating as cleanly as they were earlier in the move.
Stochastic is in overbought territory, and %K has crossed below %D. That crossover suggests upside momentum may be cooling even though the broader price structure remains bullish.
A sustained break above 0.5776 would keep the trend intact, while a deeper reversal toward 0.5645–0.5680 would test whether buyers are still willing to defend the current structure.
Buyers now need to push decisively through 0.5776 to confirm another continuation leg.
Sellers would first need to force price back below roughly 0.5748, followed by a break into and ultimately through the 0.5645–0.5680 demand zone, before the bullish sequence of higher highs and higher lows would be seriously threatened.
Trade Idea: Bullish Continuation Scenario
Setup
The bullish case remains supported by the sequence of higher highs and higher lows established since early July.
The primary area buyers need to defend on a pullback is the green demand zone at 0.5645–0.5680. For immediate uptrend continuation, price needs to clear the recent swing high around 0.5776.
The overbought Stochastic and bearish %K/%D crossover argue for some caution near the highs, particularly after the long-legged doji.
A clean breakout above 0.5776, however, would show that price is overcoming that short-term loss of momentum.
Entry
Consider entering long on a daily close above 0.5776, confirming that buyers are breaking out of the recent structure.
Alternatively, enter on a controlled pullback into 0.5645–0.5680 if price stabilizes there and turns back higher.
If price loses that support zone and closes decisively below 0.5645, stand aside and wait for either deeper support to form or a cleaner breakout later.
Stop Loss
For breakout entries: stop on a daily close back below 0.5748. That would invalidate the breakout by showing price could not stay above the former ceiling.
For pullback entries: stop on a daily close below 0.5645. That would invalidate the support-hold idea and show buyers are no longer defending the zone.
Take Profit
Target 0.6000, because it is a major round-number psychological level and a natural area where price could encounter increased profit-taking or resistance if the current uptrend extends.
Bottom Line
The bullish structure remains intact while AUD/CHF continues making higher highs and higher lows and holds above the 0.5645–0.5680 demand zone.
A daily close above 0.5776 would confirm another breakout and put the psychological 0.6000 level in focus.
The long-legged doji and bearish Stochastic crossover suggest momentum could pause before that happens.
A decisive close below 0.5645 would invalidate the bullish support-hold scenario and expose the deeper demand zone.
Trade Idea: Bearish Pullback Scenario
Setup
The bearish case is based on signs that the latest advance may be losing momentum around 0.5760–0.5776.
The long-legged doji shows indecision near the highs, while the Stochastic %K crossover below %D from overbought territory adds evidence that short-term momentum is cooling.
For sellers to turn that hesitation into a meaningful pullback, price would need to move below 0.5748 and eventually break the green demand zone at 0.5645–0.5680.
A decisive loss of 0.5645 would represent the clearest deterioration in the current bullish structure.
Entry
Consider entering short on a daily close below 0.5645, confirming that the support zone has failed.
Alternatively, if price pushes into 0.5760–0.5776 and prints a clear bearish rejection candle, enter short on the next daily close back below 0.5748.
If price instead breaks and closes decisively above 0.5776, stand aside, as that would invalidate the bearish pullback idea.
Stop Loss
For breakdown entries: stop on a daily close back above 0.5680. That would invalidate the breakdown by showing price has reclaimed the support zone.
For rejection entries near resistance: stop on a daily close above 0.5776. That would invalidate the bearish idea by confirming buyers have pushed through resistance.
Take Profit
Target 0.5550–0.5595, because that is the next major green demand zone below the current structure and the most likely area where buyers would try to step back in.
Bottom Line
The bearish scenario becomes more compelling if AUD/CHF continues to reject 0.5760–0.5776, particularly with Stochastic momentum already turning lower from overbought territory.
A move below 0.5748 would be an early sign of weakness, but a daily close below 0.5645 would provide the stronger breakdown confirmation.
If that demand zone fails, 0.5550–0.5595 becomes the primary downside target. A decisive close above 0.5776 would invalidate the bearish rejection setup and favor continuation of the broader uptrend.
This content is strictly for informational purposes only and does not constitute as investment advice. Trading any financial market involves risk. Please read our Risk Disclosure to make sure you understand the risks involved.



