





AUD/CHF is sending an early warning that recent upside momentum may be fading, even as the latest daily candle closed higher.
With price still holding near the upper end of its recent range, the next few sessions may clarify whether this is a routine pause or the start of a deeper correction.
Welcome to “TA Alert of the Day.” Each day after the market close, MarketMilk scans for popular technical indicator alerts. We use these alerts as the basis for a mini-lesson, breaking down what each alert means, why it matters, and how traders might interpret it. The goal is to help beginner traders not only spot these alerts but also understand the logic behind them and how they can inform trading decisions.
What MarketMilk Has Detected
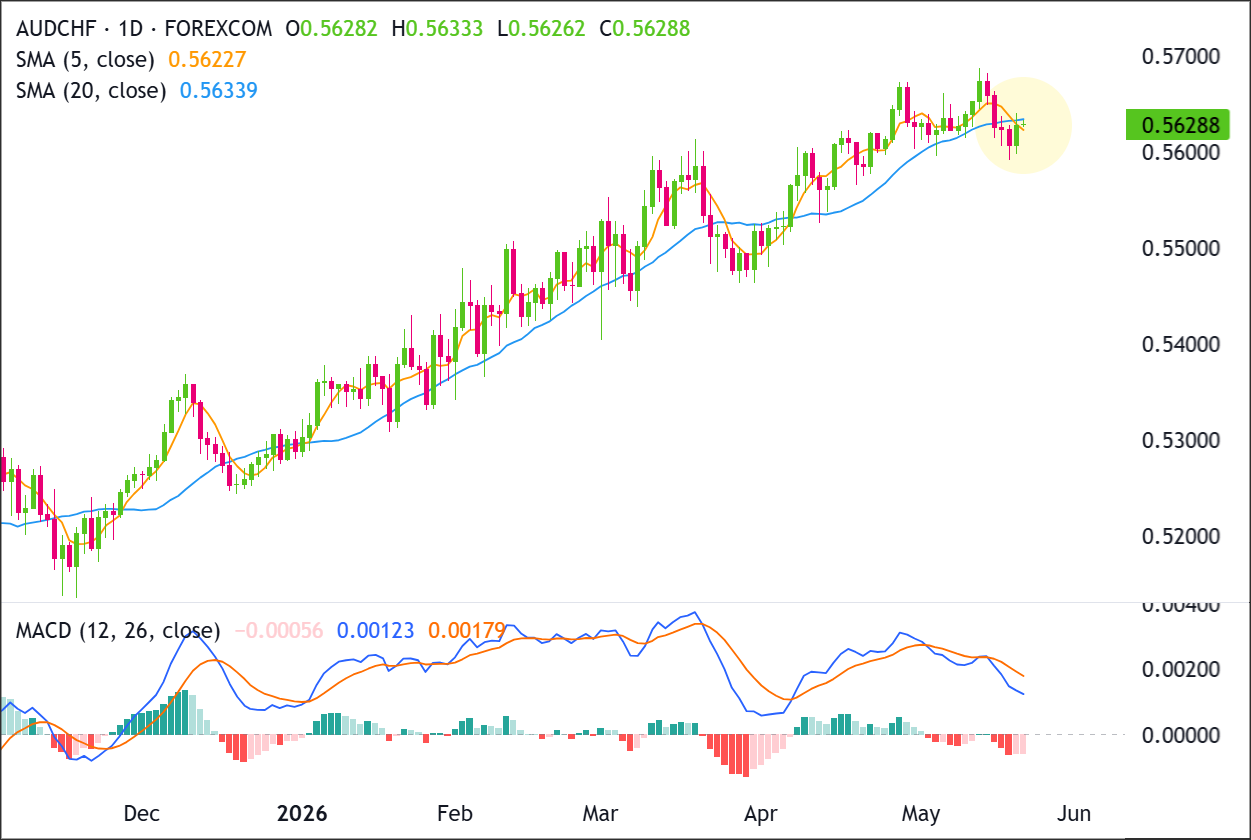
MarketMilk detected a bearish 5-day SMA crossing below the 20-day SMA on the daily chart.
From the historical swing structure, nearby support is visible around 0.560–0.561 (repeated tests in early-to-mid May), with a deeper support shelf around 0.547–0.550 (late March lows).
On the upside, resistance stands out near 0.5668–0.5687 (late April/May highs).
The crossover happening while price is still hovering near 0.563 suggests the signal is more about momentum cooling than a confirmed breakdown.
What This Signals
Traditionally, a 5 SMA crossing below the 20 SMA suggests that short-term price action is losing pace relative to the medium-term trend.
If the move is sustained, this development can attract trend-followers looking for a transition from an uptrend into a consolidation phase or a pullback, particularly after price failed to build on the push into the 0.567–0.569 area.
However, this same pattern can also represent a whipsaw in a range-bound market, where prices briefly dip and then rotate higher again.The latest candle closed higher on the day, and the two moving averages are extremely close.
Cnditions that sometimes coincide with quick “recross” action if buyers defend the 0.560–0.561 area and reclaim the mid-range.
The outcome depends heavily on follow-through price action after the crossover, the slope of the 20-day SMA (flattening vs turning down), and whether AUD/CHF holds or loses the nearby support band.
Context and confirmation are essential, especially because this crossover occurred after several weeks of sideways-to-choppy trade near the highs rather than after a clean breakdown.
How It Works
A simple moving average (SMA) smooths price by averaging closes over a fixed lookback window.
The 5-day SMA tracks short-term momentum, while the 20-day SMA represents a broader, medium-term baseline.
When the 5 SMA crosses below the 20 SMA, it indicates that recent closes are, on average, weakening relative to the prior few weeks.
Because moving averages are lagging, crossovers typically confirm that a shift has already started rather than predicting a turn in advance.
They tend to work better when price is trending and can be less reliable when the market is oscillating in a tight range.
Important: Moving-average crossovers can generate false signals when volatility compresses and price repeatedly crosses back and forth around the averages. Reliability often improves when the crossover is accompanied by a clear break of a well-watched support level or when the longer SMA begins to slope decisively in the crossover direction.
What to Look For Before Acting
Do not assume the signal implies an immediate downtrend. Consider these factors:
✅ Whether AUD/CHF closes below 0.560–0.561 (near-term support that has been tested multiple times)
✅ A follow-through sequence of lower highs and lower lows on the daily chart, rather than a single crossover print
✅ The 20-day SMA turning from flat to clearly downward sloping (helps reduce whipsaw risk)
✅ Whether rallies stall below prior resistance near 0.5668–0.5687 (late April/May supply zone)
✅ Signs of rejection on retests of the moving averages (price failing to reclaim the 20-day after the cross)
✅ Alignment with the Weekly timeframe trend/structure (e.g., whether weekly candles are also losing upside traction)
✅ Volatility conditions: expanding ranges in the direction of the move can add confidence; contracting ranges can hint at chop
✅ Upcoming macro drivers relevant to AUD and CHF (e.g., risk sentiment shifts, central bank expectations) that could amplify or fade technical follow-through
Risk Considerations
⚠️ Whipsaw risk is elevated because the 5 SMA and 20 SMA are separated by only a small margin.
⚠️ Price is still near the recent upper range; a quick push back toward 0.566–0.569 can invalidate the bearish read.
⚠️ Crossovers are lagging and may appear after much of the short-term move has already played out.
⚠️ Support around 0.560–0.561 has held recently; fading the market into support can produce sharp snapbacks.
Potential Next Steps
Recent candles show hesitation after the failed push toward 0.5680-0.5690, with price pulling back into the 0.5600-0.5635 consolidation area.
Buyers need to defend 0.5600-0.5620 and reclaim momentum above 0.5640-0.5650 before challenging the highs again.
Sellers need a decisive close below 0.5600 to confirm that the recent consolidation is turning into a deeper pullback.
Trade Idea: Bullish Continuation Scenario
Setup
The bullish setup is a continuation attempt from the current consolidation above 0.5600.
AUDCHF has been trending higher for several months, so the key question is whether buyers can defend the 0.5600-0.5620 support zone and push price back through the short-term resistance area near 0.5640-0.5650.
A successful breakout above that zone would put the recent highs near 0.5680-0.5700 back in play.
Entry
Consider entering long on a daily close above 0.5650, confirming that buyers are breaking out of the recent structure.
Alternatively, enter on a controlled pullback into 0.5600-0.5620 if price stabilizes there and turns back higher.
If price loses that support zone and closes decisively below 0.5600, stand aside and wait for either deeper support to form or a cleaner breakout later.
Stop Loss
For breakout entries: stop on a daily close back below 0.5620. That would invalidate the breakout by showing price could not stay above the former ceiling.
For pullback entries: stop on a daily close below 0.5600. That would invalidate the support-hold idea and show buyers are no longer defending the zone.
Take Profit
Target 0.5680-0.5700, because that is the next clear upside area on the chart and the most natural place for price to retest if the current recovery continues.
Bottom Line
The bullish case depends on AUDCHF holding 0.5600-0.5620 and reclaiming 0.5650 on a daily close. If that happens, buyers would have a reasonable path back toward 0.5680-0.5700.
The setup loses strength if price closes decisively below 0.5600.
A break under that level would suggest the current consolidation has failed and that the market may need a deeper reset before another bullish attempt.
Trade Idea: Bearish Pullback Scenario
Setup
The bearish setup is a pullback from the recent rejection zone near 0.5680-0.5690. Price has stalled below 0.5700 and is now sitting close to the 0.5600-0.5635 support area.
Sellers need a daily close below 0.5600 to confirm that the support zone has failed and that momentum is shifting away from the prior uptrend.
Entry
Consider entering short on a daily close below 0.5600, confirming that the support zone has failed.
Alternatively, if price pushes into 0.5680-0.5700 and prints a clear bearish rejection candle, enter short on the next daily close back below 0.5650.
If price instead breaks and closes decisively above 0.5700, stand aside, as that would invalidate the bearish pullback idea.
Stop Loss
For breakdown entries: stop on a daily close back above 0.5635.
That would invalidate the breakdown by showing price has reclaimed the support zone.
For rejection entries near resistance: stop on a daily close above 0.5700. That would invalidate the bearish idea by confirming buyers have pushed through resistance.
Take Profit
Target 0.5500-0.5520, because that is the next major support area below the current structure and the most likely place where buyers would try to step back in.
Bottom Line
The bearish case depends on AUDCHF failing below the 0.5680-0.5700 resistance zone and closing below 0.5600.
That would confirm a breakdown from the current consolidation and open the door for a pullback toward 0.5500-0.5520.
The bearish idea is invalidated if price reclaims strength and closes decisively above 0.5700. A move through that level would confirm buyers have broken the prior ceiling and would weaken the pullback setup.
This content is strictly for informational purposes only and does not constitute as investment advice. Trading any financial market involves risk. Please read our Risk Disclosure to make sure you understand the risks involved.



