





Silver just broke below the neckline of a Head and Shoulders pattern, but price is stalling as dollar traders brace for the FOMC meeting minutes.
Will a hawkish Fed bring more bearish pressure?
Or will longer-term support levels hold as U.S. Treasury yields retreat?
Here are the inflection points to watch on multiple time frames:
Multi-Timeframe Technical Breakdown
Silver (XAG/USD): Weekly
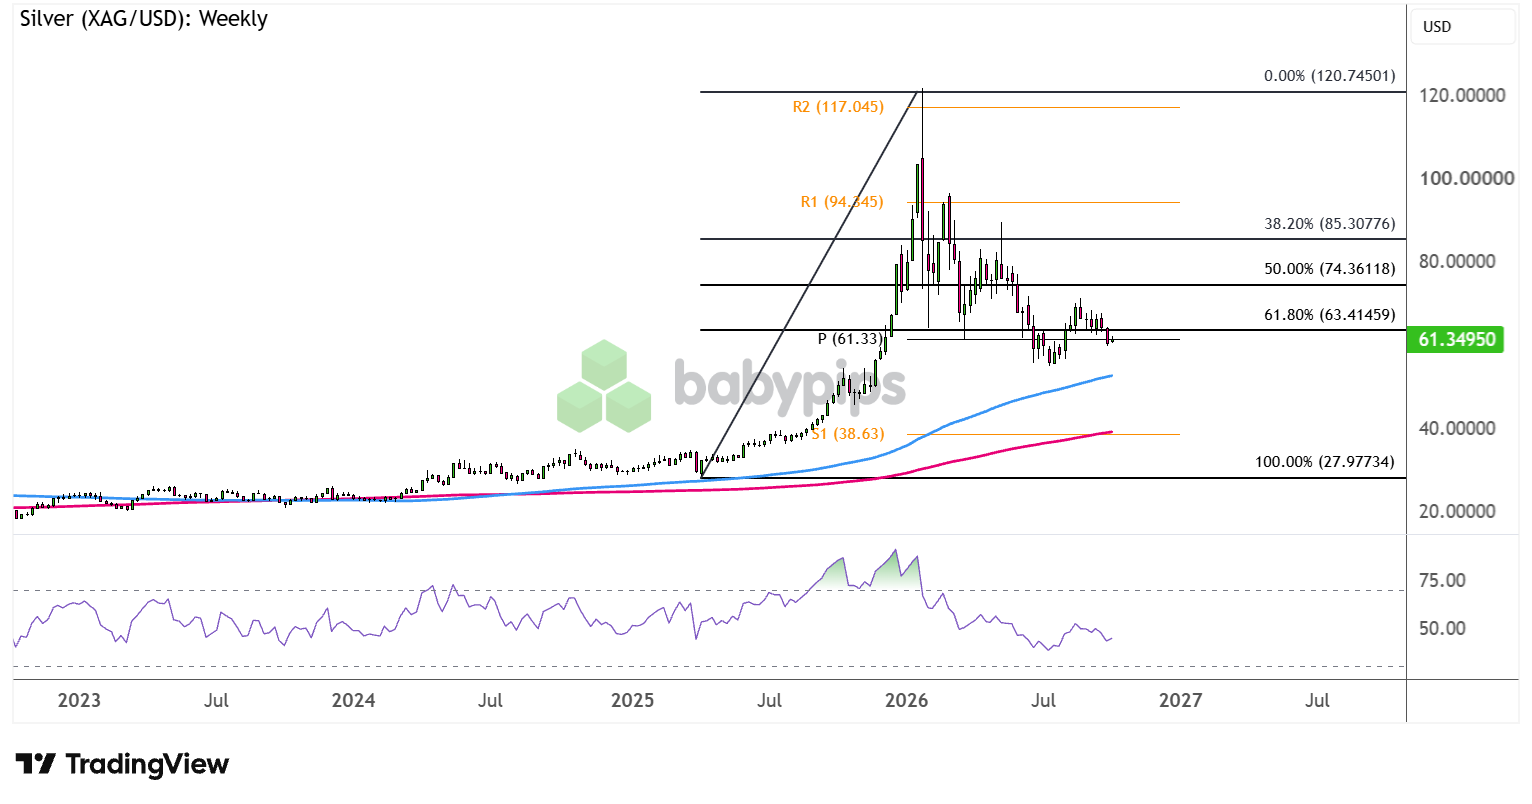
Silver (XAG/USD) Weekly Chart Faster with TradingView
Silver climbed from about $28 in spring 2025 to a peak near $120.75 in late January 2026. Since then, it has made lower highs and lower lows.
Price still trades above the 100 SMA and 200 SMA. Both lines slope up, which suggests the long-term uptrend has not broken. The RSI reads near 45. Sellers hold a slight edge, but silver is not oversold.


