
September gave us two very different events:
META has produced its strongest month in more than a decade and is now knocking on the door of its all-time high.
EUR/USD, meanwhile, has spent months compressing between a descending trendline and a major support zone around $1.14.
One looks almost too bullish to buy, the other — almost too bearish to sell. Those are usually the charts worth looking at.
META’s Mega Month: What Comes Next?
Meta has spent September doing something that gets increasingly difficult when you’re already one of the world’s biggest companies: moving like a small-cap stock.
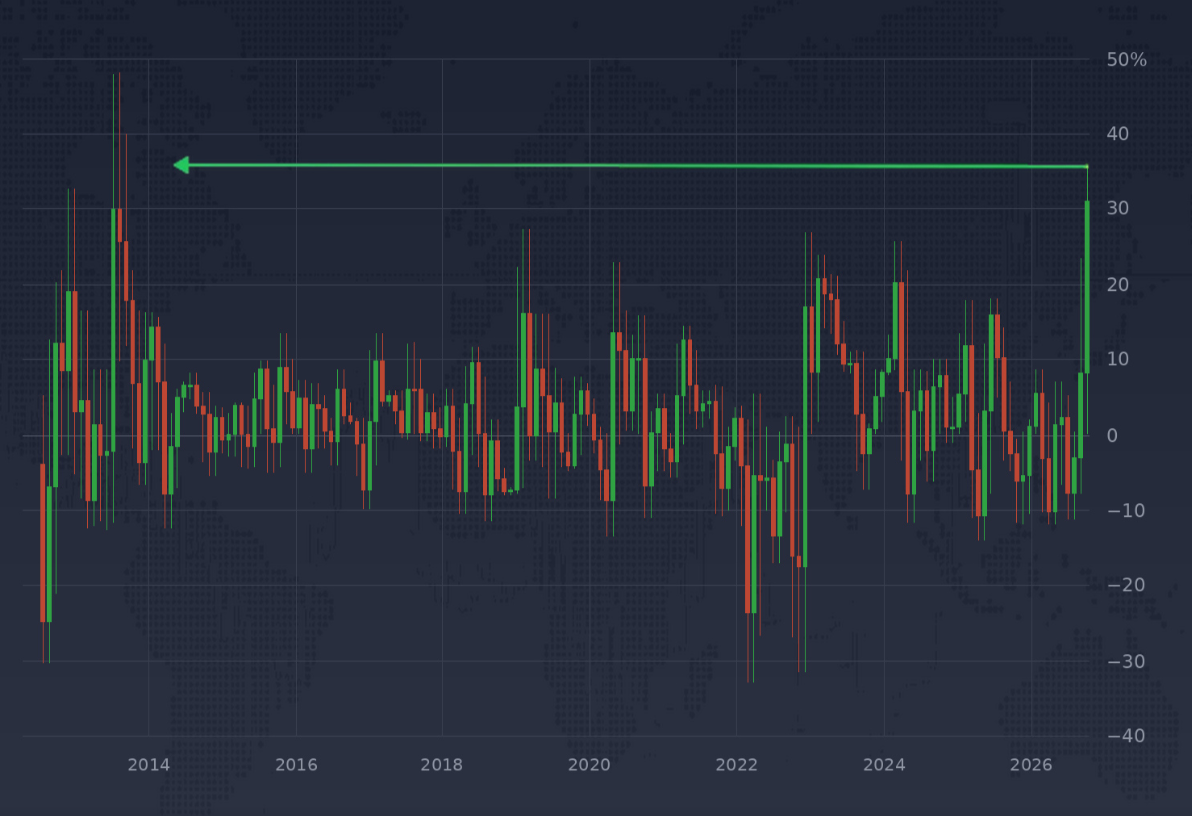
At one point this month, META was up roughly 36%, putting September on track to become its strongest month since July 2013.
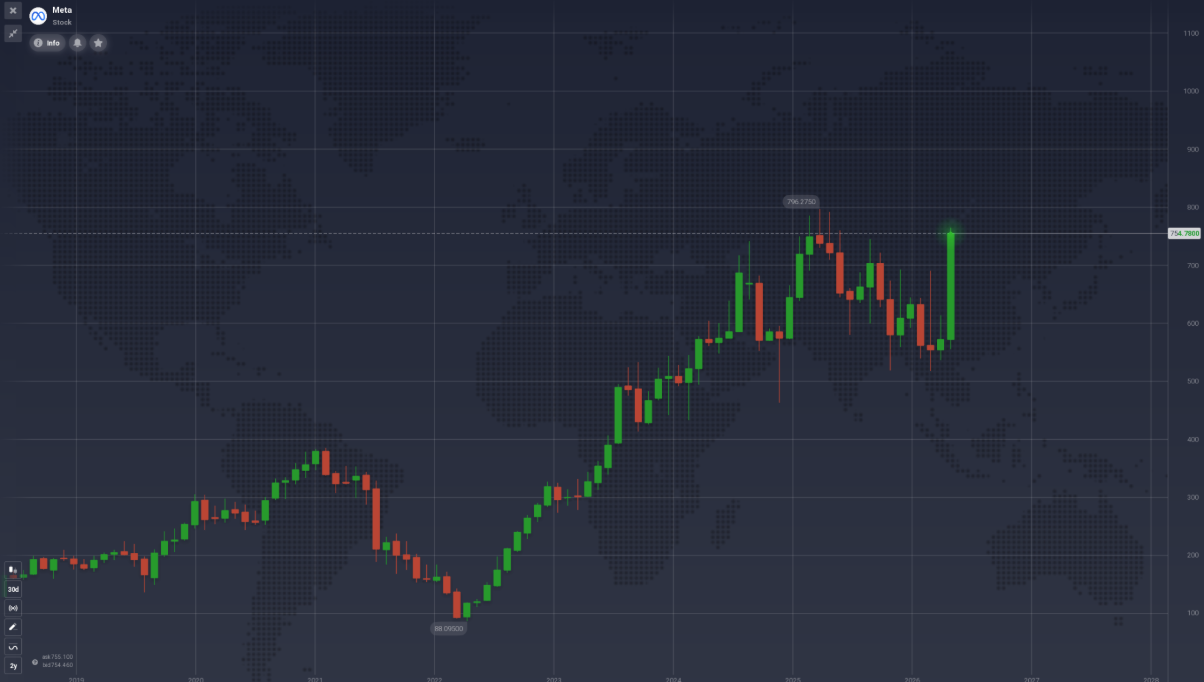
For perspective, Meta’s best completed month ever was July 2013, when the stock gained almost 48%.
The speed of the latest move is even more striking. META finished August at around $572. By September 24, it had traded as high as $779.82. That’s more than $200 added to the share price in less than a month.
Unlike many sudden tech rallies, there’s an obvious catalyst behind this one:
Muse — META’s New AI
On September 8, Meta launched Muse, its new autonomous AI assistant. Muse can do considerably more than answer questions: Meta designed it to handle tasks such as booking travel, sending emails, completing forms and making transactions. There are free and paid versions, giving Meta something investors have wanted to see for a while: a potentially direct way to monetize its enormous AI spending.
Muse quickly climbed the app rankings, with more than 2.5 million estimated downloads in its first two weeks. META jumped 6.5% on September 9, then exploded another 11.3% on September 21 as enthusiasm around the product accelerated.
That matters because the argument around Meta had increasingly become: Sure, AI is exciting. But when does spending billions on it actually make money?💸
Muse hasn’t answered that question yet, but it has given investors something tangible to work with.
Meta is expected to spend close to $140 billion in capital expenditures this year, roughly twice its 2025 level. The new product may improve the bull case, but Meta still has to prove that its AI investments can generate enough revenue to justify that bill.
The Problem: The Rally Already Happened
So, META was obviously bullish during the September surge. But there’s a difference between “this stock is going up” and “this is still a good place to chase it.”
The chart has now changed: META reached around $790.50, essentially testing the previous record area around $790–800. It has since pulled back toward $720–725.
That’s not necessarily a bearish signal. After a move of this size, some profit-taking is hardly surprising. The more interesting question now is what happens after the first correction.
Rather than trying to guess whether META has topped or whether the rally will immediately resume, there are two setups worth watching.
Scenario #1: Wait for the $680 pullback
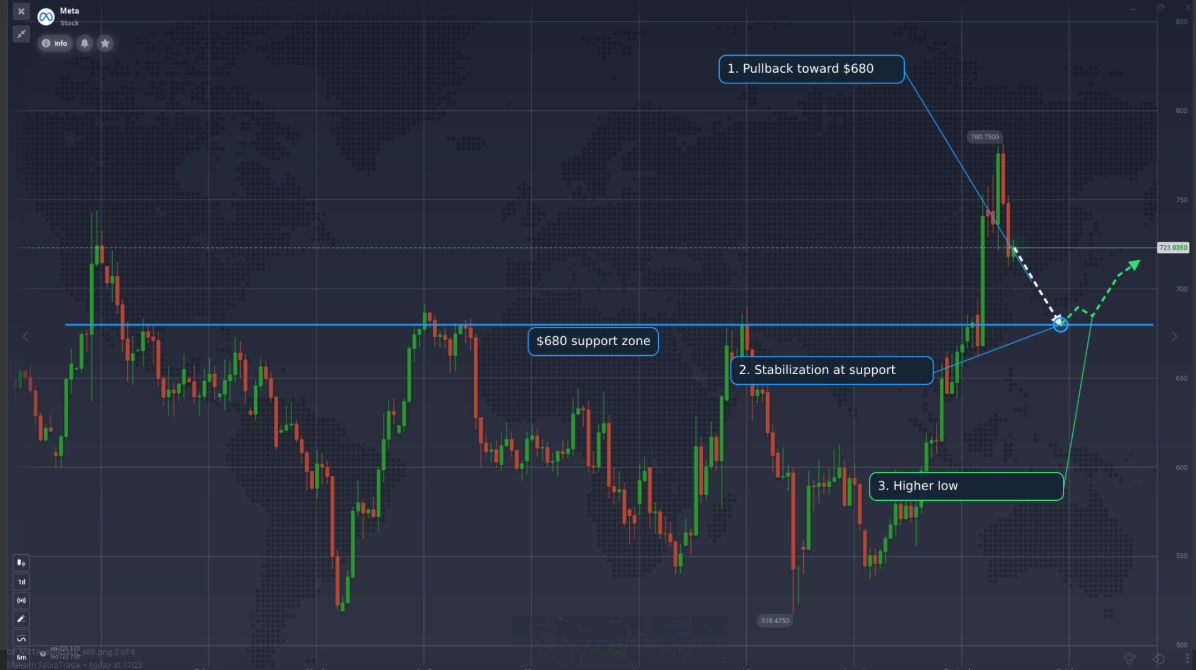
Around $680 is still the first area we’d watch on a deeper correction. META spent several sessions consolidating around roughly $650–690 before the latest acceleration, making this an interesting potential support area if the correction continues.
A move toward $680 would also answer an important question: Are buyers willing to defend the breakout once the September FOMO disappears?
If META falls toward $680, stabilizes and begins forming a higher low, traders could get a much cleaner long setup than simply buying after a 30%+ monthly rally.
Scenario #2: Make META Prove It Can Break the ATH
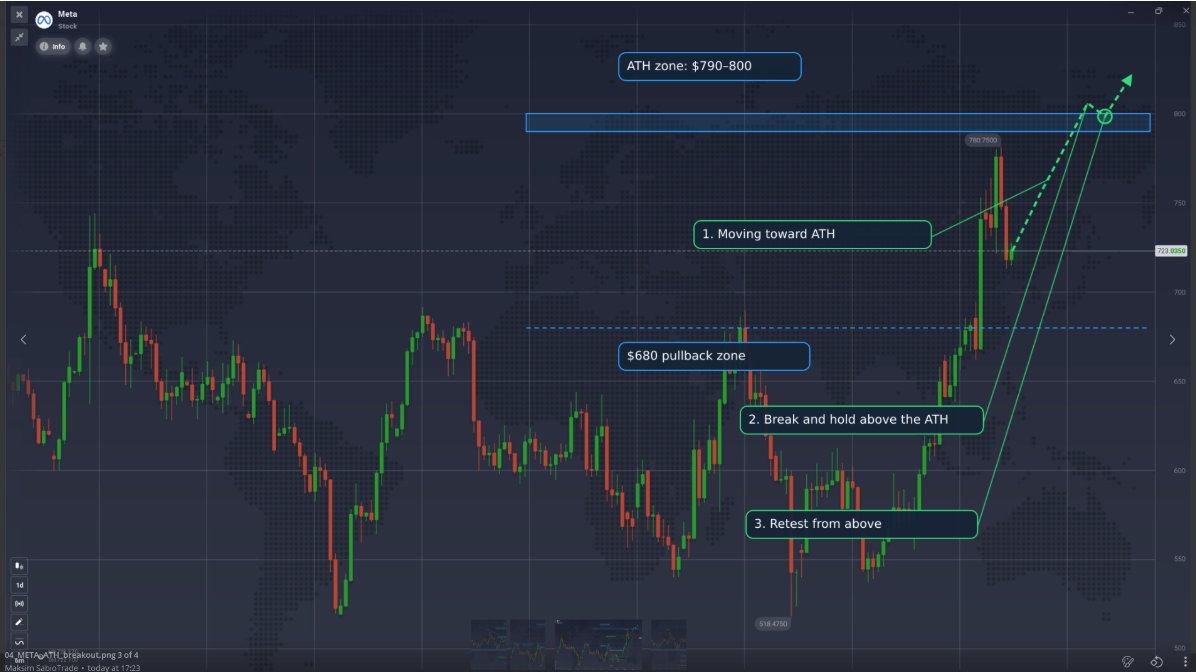
META has already pulled back from its September high around $780, but the previous all-time-high area around $790–800 is still ahead.
That means there’s no reason to assume the ATH will reject the price — META hasn’t even tested it yet. For traders who don’t want to buy during the correction, there’s another option: wait for confirmation.
If buyers push META back toward the ATH and price eventually breaks decisively above $790–800, the setup becomes much more interesting. The old record could then stop acting as resistance and potentially become a new support area.
The key is what happens after the breakout. A brief move above the ATH isn’t necessarily enough. Breakouts can fail, especially after such a powerful rally. Traders could instead watch for a close above the record, consolidation, or a successful retest from above.
META Trader’s Watchlist
$790–800: The big test. Watch for a decisive breakout and whether META can hold above the previous record.
Around $680: Potential pullback zone. If META reaches this area, watch for stabilization and a higher low before considering a long.
Volume: Strong volume behind a breakout would make the move more convincing; weakening participation near the highs could make rejection more interesting.
Muse: Monetization will eventually have to justify the hype created by dowloads. Muse is still new, and its early popularity hasn’t yet translated into reported revenue.
AI spending: Meta’s enormous capex bill hasn’t disappeared just because the stock rallied. How quickly new AI products turn spending into revenue remains central to the longer-term story.
The Bigger Lesson
META presents traders with one of the oldest traps in the market: A great company, a great catalyst and a great chart don’t necessarily equal a great entry.
September has dramatically strengthened Meta’s stock, taking it from around $558 to roughly $780 in just a few weeks. But after such a powerful move, the question isn’t whether META can keep going higher — it’s where the next clean setup could appear.
A pullback toward $680 could give bulls a chance to look for support and a higher low. Alternatively, traders who prefer confirmation could wait for META to break $790–800 and prove it can hold above the ATH.
Let META come to one of those levels — and see what it does there.
Whether you’re trading stocks or currencies, waiting for confirmation and managing risk matter. Learn more about SabioTrade and its funded trading program.
EUR/USD at the Floor: Break It or Bounce?
META is testing the ceiling. EUR/USD is doing almost the exact opposite.
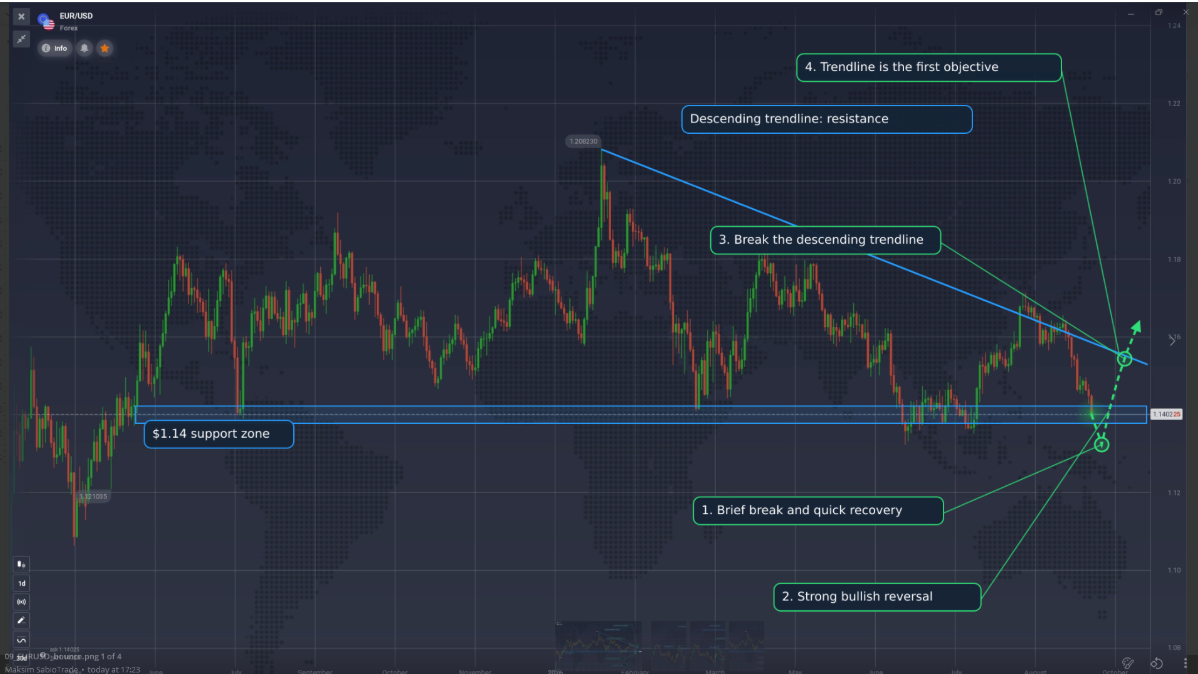
After spending much of 2026 moving sideways, the pair has drifted back toward one of the clearest levels on its chart: the $1.14 area.
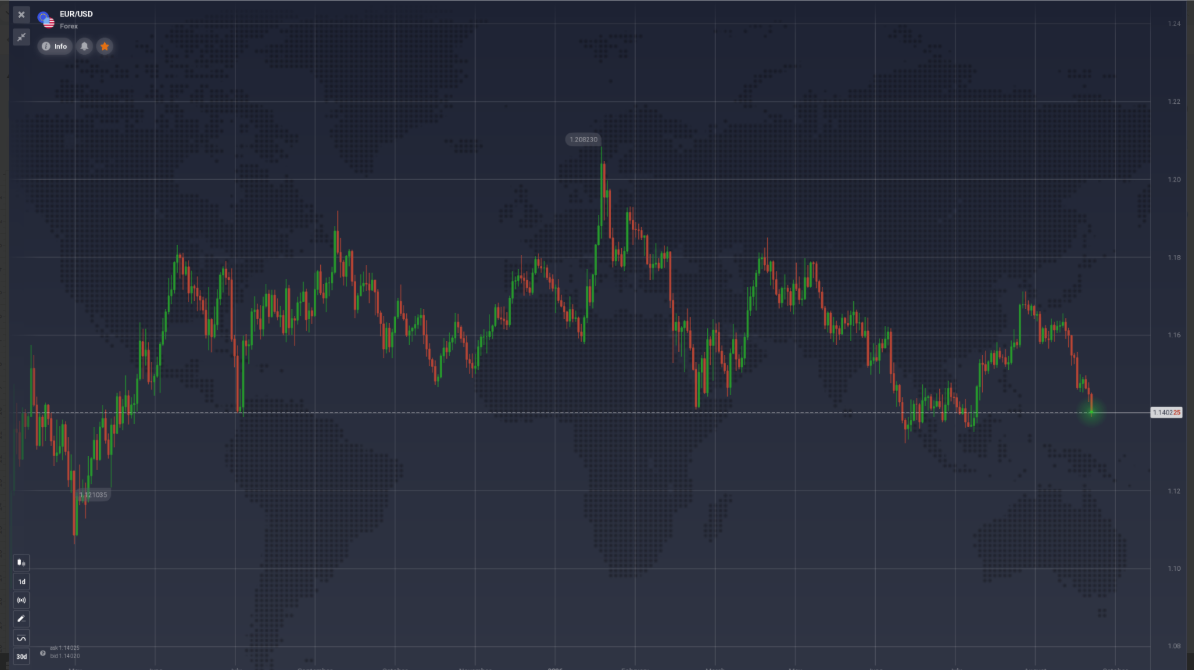
And this isn’t for the first time — the $1.14 area has repeatedly attracted buyers since last spring, while every major rebound has struggled beneath a descending trendline from the January high. That leaves EUR/USD squeezed between two forces: falling resistance above + stubborn support below.
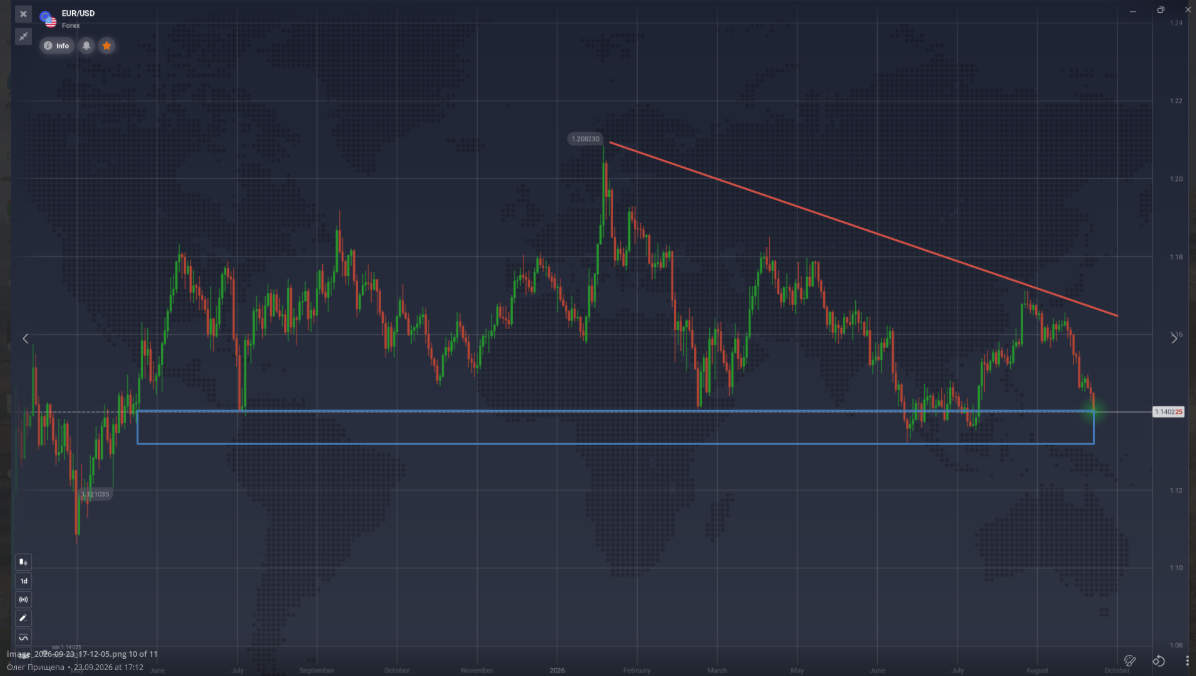
Something eventually has to give.
The Dollar Has One Big Thing Going for It
Start with the simplest fundamental argument: interest rates. The Federal Reserve’s benchmark rate currently stands at 4.00%, while the ECB’s September hike brought its deposit rate to 2.50% and main refinancing rate to 2.65%. In other words, dollar rates remain substantially higher even after the ECB tightened policy this month.
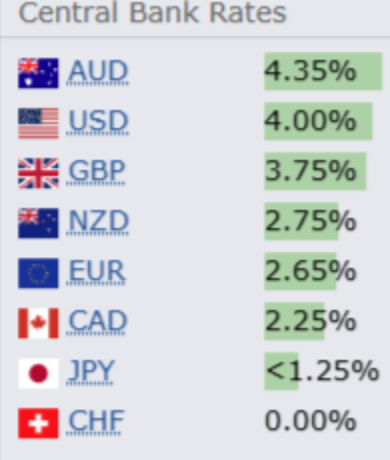
Higher interest rates can make dollar-denominated assets more attractive, all else being equal. And lately the market has been leaning into that advantage again: expectations of further Fed tightening have helped the dollar strengthen, while EUR/USD fell from around $1.165 on September 9 to $1.140 on September 25.
But rates aren’t the whole story.
Winter Is Coming — Literally
Europe is approaching winter with another awkward variable hanging over the euro: energy.
EU gas storage is currently below historical levels. At the same time, geopolitical uncertainty remains elevated, including disruptions to Qatari LNG production. That’s relevant because Europe remains a major importer of fossil fuels, which makes its economy more exposed to external energy shocks.
Before we declare another European energy apocalypse, though, there’s an important caveat. The European Commission says EU gas supplies remain stable despite the lower storage levels. Europe now has more LNG capacity, more diversified suppliers and lower gas demand than it did during the 2021–22 crisis. Protected customers are expected to remain supplied even under adverse conditions.
Long story short, Europe is not necessarily about to run out of gas — but energy is once again a vulnerability.
A cold winter, another geopolitical shock or a sustained jump in gas and oil prices could hurt European growth while simultaneously keeping inflation elevated. The ECB itself now forecasts only 0.9% euro-area growth in 2026, while warning that the energy shock creates upside risks to inflation and downside risks to growth.
That’s not exactly the macro combination the euro dreams about.
So Why Not Just Short EUR/USD?
Because there’s an annoying rectangle around $1.14 on our chart.
Fundamentals can tell us why the dollar should be stronger. They can’t guarantee that traders haven’t already priced much of that story in. And EUR/USD is currently sitting almost directly on a support zone that has survived several previous attacks.
Selling straight into support therefore means betting that this time is different before the chart has actually proved it.
There are two cleaner ways to approach it.
Scenario #1: $1.14 Finally Breaks
If EUR/USD closes decisively below the $1.14 support zone, the technical picture changes significantly.
The pair would no longer simply be oscillating inside its broad range. We’d have both a sequence of lower highs beneath the descending trendline and a breakdown of the floor that has supported price for more than a year.
But even here, patience could matter.
Rather than chasing the first candle through support, traders could watch for a break → retest → rejection: EUR/USD falls below $1.14, attempts to recover the level, but former support begins behaving as resistance.
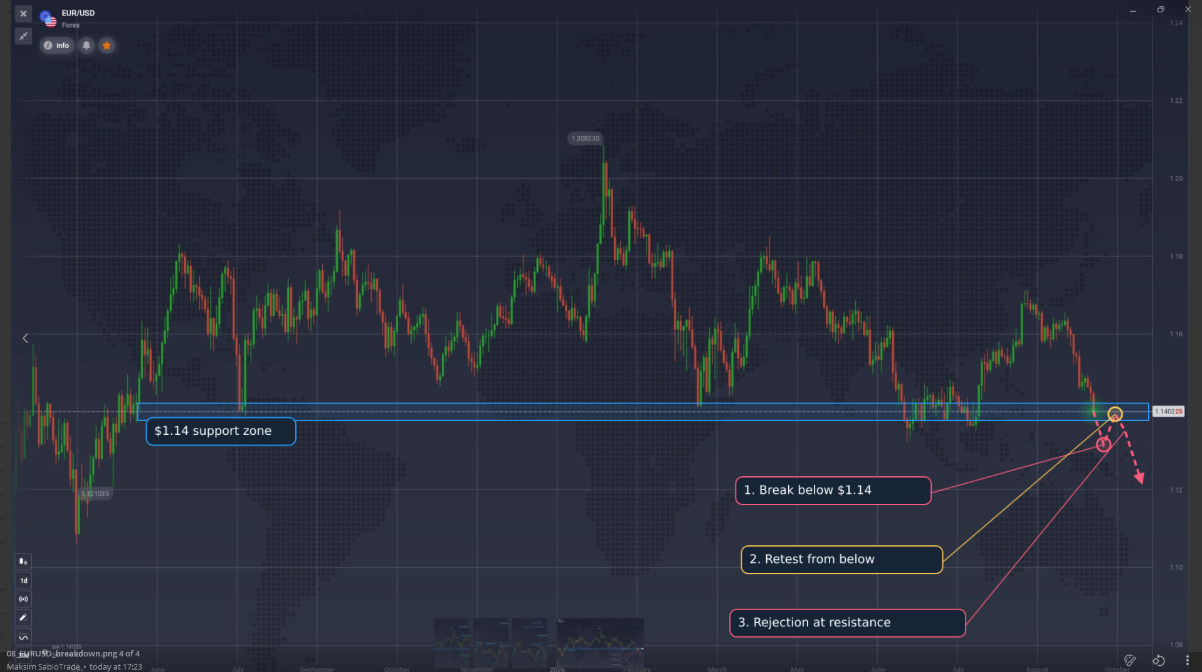
That would give bears considerably more confirmation than simply shorting because the macro story sounds gloomy.
Scenario #2: The Floor Holds — Again
What if EUR/USD briefly breaks $1.14…and comes straight back? Or touches the support zone, produces a strong bullish reversal and starts climbing?
That would tell us sellers have had another opportunity to break one of the most obvious levels on the chart — and failed.
For bulls, that failure could itself become the signal. The first major objective wouldn’t necessarily be a giant new euro bull market. It would simply be the descending trendline overhead.
If EUR/USD can bounce from support and then break that trendline, however, the larger picture becomes considerably more interesting: the pair would have defended its long-term floor while finally escaping the sequence of lower highs.
So yes, there’s a short setup here. But there’s potentially a long setup hiding inside the exact same chart.
EUR/USD Trader’s Watchlist
$1.14 support: The main battlefield. A clean break changes the structure; another rejection keeps the range alive.
The descending trendline: Still the major technical obstacle for bulls.
Break + retest: Bears may want to see former support turn into resistance rather than anticipating the breakdown.
Failed breakdown: A move below $1.14 followed by a quick recovery could become much more interesting to bulls than a simple touch of support.
Fed vs. ECB: The U.S. still has the rate advantage, but future expectations matter more than today’s rates. The ECB has already surprised markets with a September hike and says it isn’t committing to a predetermined path.
Energy: Don’t just watch storage percentages. Gas and oil prices — and whatever is driving them — may matter more for the euro as winter approaches.
The Bigger Lesson
EUR/USD is a nice reminder that a bearish story and a good short aren’t necessarily the same thing.
The dollar has the higher interest rate. Europe has an uncomfortable energy sensitivity heading into winter. And technically, EUR/USD remains below a descending trendline.
That’s a decent bearish story — but there’s one problem: $1.14 hasn’t broken yet.
If it does, bears finally get confirmation. If it doesn’t, traders may discover that the more interesting trade was hiding on the other side all along.