





WTI crude oil appears to have broken below the neckline of a complex Head and Shoulders pattern.
Can this pullback gather more selling energy?
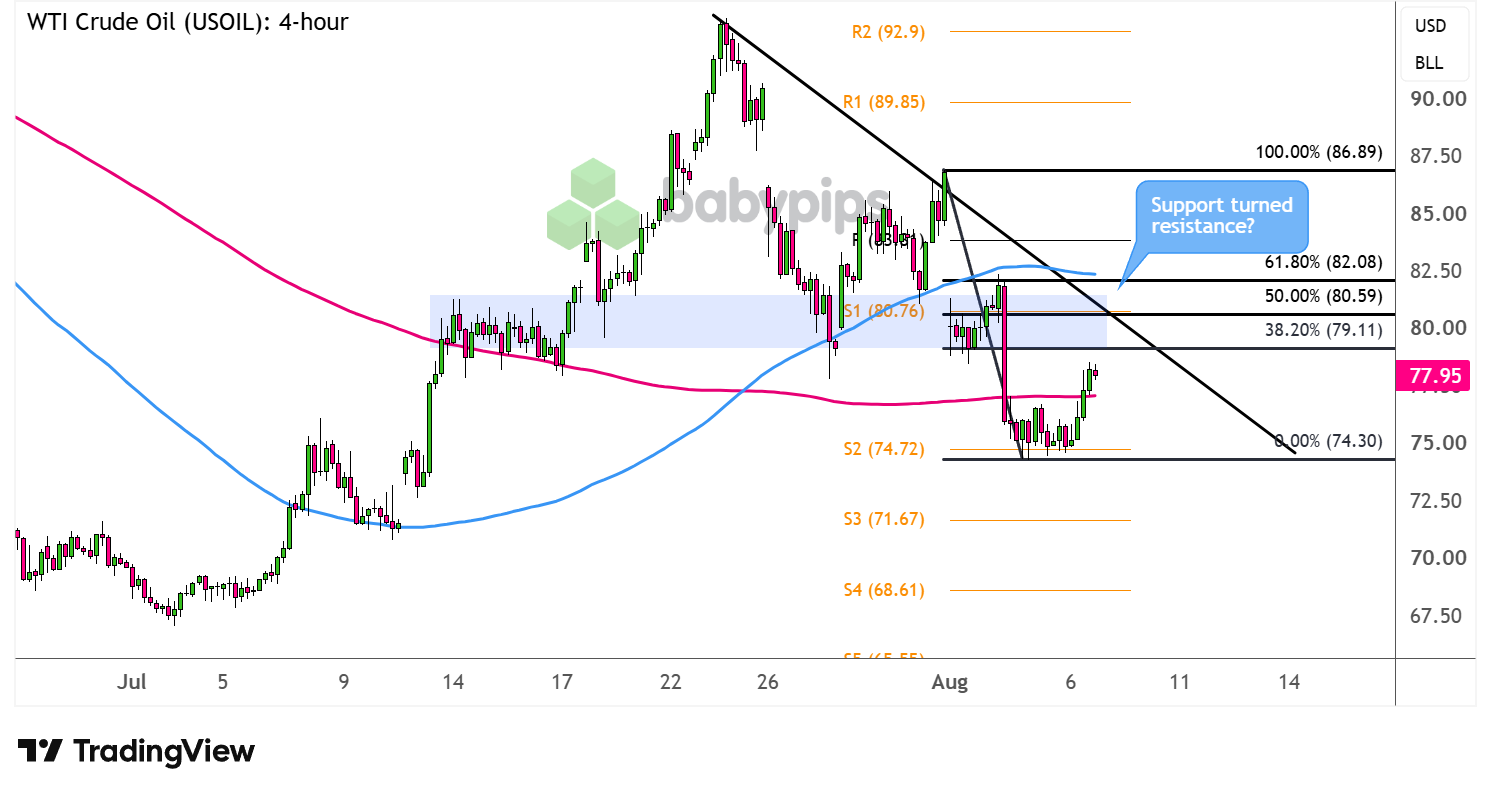
Here are the potential retracement levels to watch on the 4-hour time frame.
WTI Crude Oil (USOIL): 4-hour
WTI Crude Oil (USOIL) 4-hour Chart Faster with TradingView
Easing geopolitical tensions amid prospects of a US-Iran deal and the reopening of the Strait of Hormuz are once again forcing this energy commodity to unwind its war premium.
However, uncertainty still remains as a news agency in Iran circulated a draft plan for the strait carrying far more restrictive shipping conditions, reviving oil supply concerns.
Can WTI crude oil’s selloff carry on?
Crude oil has pulled up from S2 ($74.72) to inch closer to the 38.2% Fibonacci retracement level at $79.11 where sellers could be looking to jump in.Remember that directional biases and volatility conditions in market price are typically driven by fundamentals. If you haven’t yet done your homework on WTI crude oil and the U.S. dollar, then it’s time to check out the economic calendar and stay updated on daily fundamental news!
A larger correction could reach the 50% Fib that’s in line with the former neckline support, which could now hold as resistance. This is also right around a short-term falling trend line serving as another upside barrier.
Look out for long green candles closing above this area of interest, as a move past the 61.8% level could clear the path for a test of the pivot point ($83.81) resistance, then the next bullish targets at R1 ($89.85) and R2 ($92.90).
Should the ceiling hold, on the other hand, WTI crude oil could set its sights back on the swing low at S2 or to fresh bearish targets at S3 ($71.67) then S4 ($68.61).
Whichever bias you end up trading, don’t forget to practice proper risk management and stay aware of top-tier catalysts that could influence overall market sentiment!
WTI crude oil’s break below its head and shoulders neckline has traders watching Fibonacci levels, pivot points, and trend lines to see if this bounce is more than just a pause. Premium members can read our lesson:
📖 How to Identify Reversals and Retracements
Reading this helps you understand how Fibonacci retracement levels are used to gauge how far a pullback might travel, how pivot points mark potential support and resistance zones, and how trend lines help you judge whether a bounce is a genuine reversal or just a retracement before the larger move resumes.
And if you’re not a Premium subscriber yet, now’s a good time to sign up.
With Babypips Premium, you get full access to School of Pipsology lessons that help you understand not just where a chart might bounce, but whether that bounce is a real reversal or just a pause before the trend continues.



