





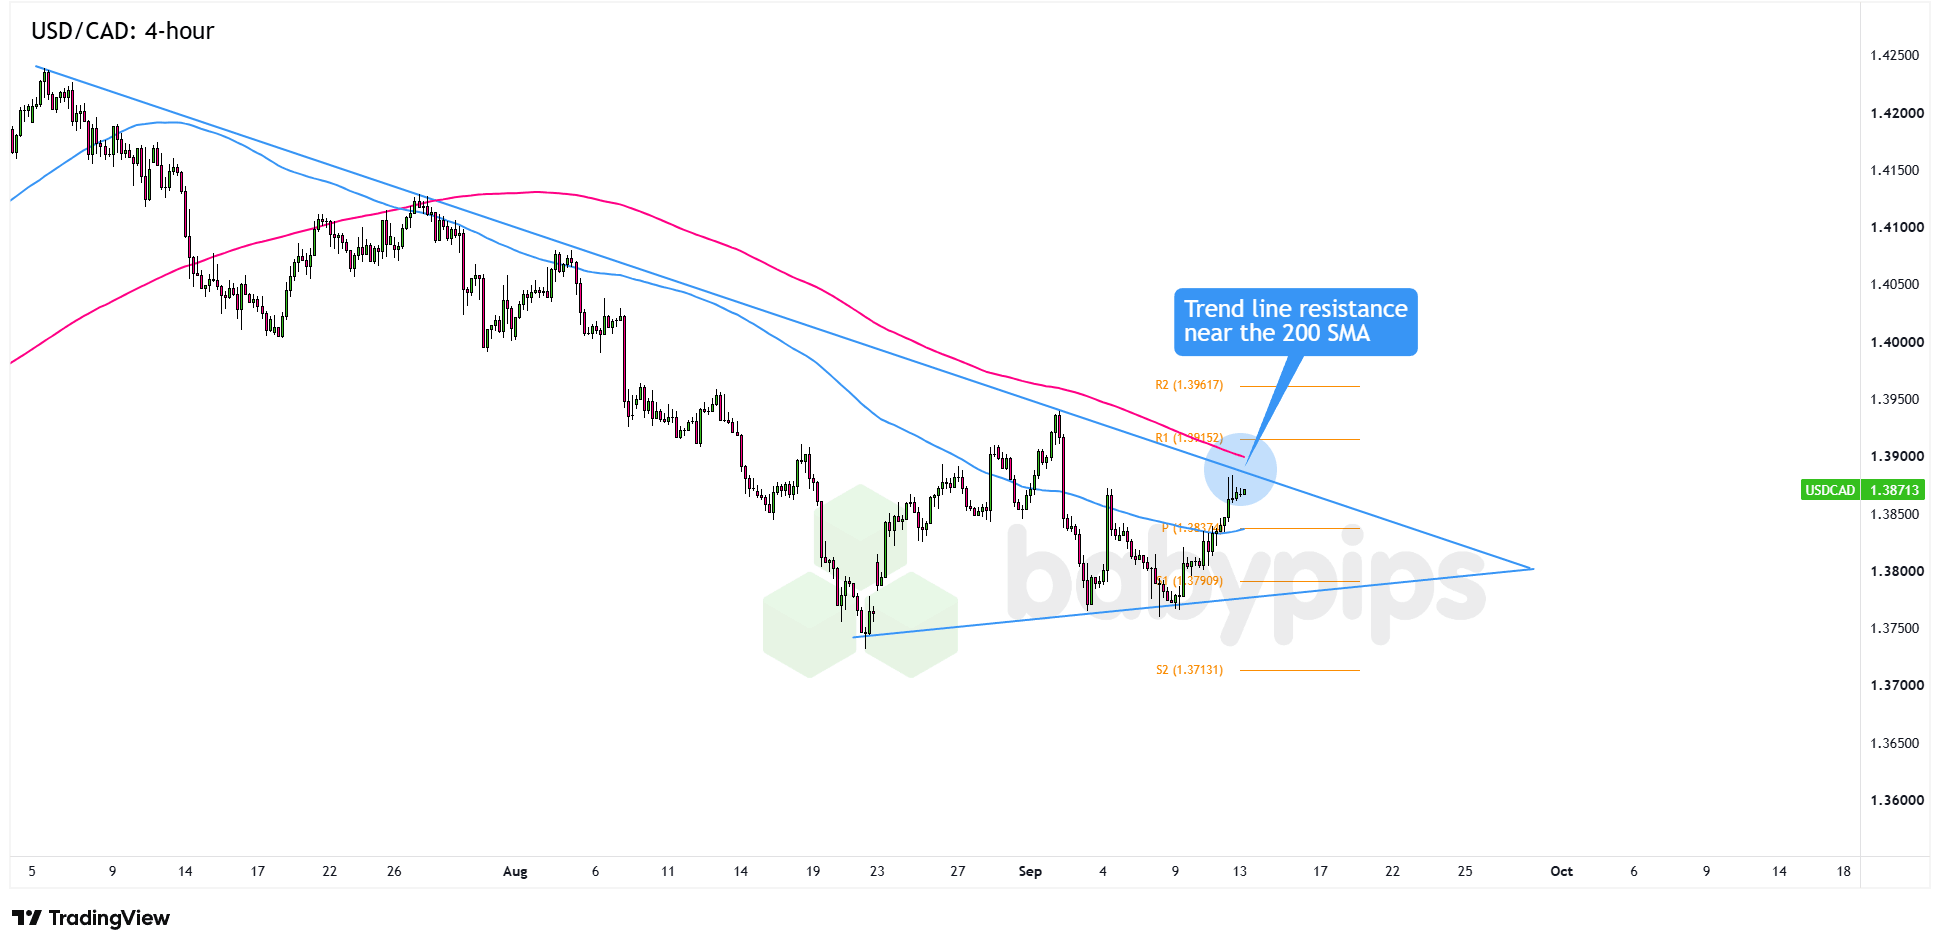
USD/CAD has been grinding inside a wedge pattern since July, and it’s now testing a key resistance zone where the descending trend line meets the 200 SMA.
Can dollar bulls force a clean breakout, or will sellers defend this confluence and send the pair back toward support?
Here are the key levels to watch on USD/CAD’s 4-hour chart!
USD/CAD: 4-hour
USD/CAD 4-hour Forex Chart Faster with TradingView
The first half of the week brings catalysts on both sides of USD/CAD. Canada’s CPI report is scheduled for Monday, and rising energy prices could push annual inflation above 3%. Even so, analysts doubt the BOC will hike this year, even if the report runs hot.
That leaves oil as the Loonie’s bigger driver. WTI crude is still retreating from last week’s highs following Friday’s sharp selloff. Monday’s Gulf Cooperation Council meeting on the Iran conflict doesn’t have a set time, so any headlines could jolt crude and CAD with little warning.
Over in the U.S., the Fed is expected to raise rates to 4.00% on Wednesday. With roughly 85% odds already priced in, the hike itself may not deliver much of a surprise. Instead, traders will zero in on the dot plot and Chair Warsh’s press conference. Signals that more hikes are coming could give the dollar another leg higher, while any attempt to frame the energy-driven inflation spike as temporary could knock some wind out of the greenback.
USD/CAD is pressing the upper boundary of the wedge, where the descending trend line meets the 200 SMA in the 1.3850 to 1.3900 area. The 100 SMA sits lower near the weekly Pivot Point at 1.3813 and has held as support during recent pullbacks.Remember that directional biases and volatility conditions in market price are typically driven by fundamentals. If you haven’t yet done your fundie homework on the U.S. dollar and the Canadian dollar, then it’s time to check out the economic calendar and stay updated on daily fundamental news!
A sustained daily close above 1.3850, followed by a clean break of the 200 SMA, could bring R1 at 1.3915 and R2 at 1.3962 into focus. Beyond those levels, buyers could set their sights on the big 1.4000 psychological handle.
On the flip side, if sellers defend the resistance confluence, the 100 SMA and Pivot Point near 1.3813 would be the first downside area to watch. Below that, the lower wedge boundary near S1 at 1.3791 could be next.
Whichever bias you end up trading, don’t forget to practice proper risk management and stay aware of top-tier catalysts that could influence overall market sentiment!
If the term “confluence” in this analysis isn’t entirely clear, or you’re wondering why the overlap of the trend line and 200 SMA matters more than either level alone, Premium members can read our lesson:
📖 Confluence: Stacking the Odds in Your Favor
Reading this helps you understand what confluence means in price action, how stacking multiple technical factors at the same level creates a stronger trade decision zone, and how to evaluate a setup based on how many factors align.
And if you’re not a Premium subscriber yet, now might be a good time to sign up.
With Babypips Premium, you get full access to School of Pipsology lessons that help you understand not just what a chart is showing, but why certain price zones carry more weight than others.



