





The Loonie may have had a brutal start to the week, but USD/CAD is now pushing into a zone where sellers have every reason to show up.
Is 1.3900 the ceiling that caps this rally, or the floor that confirms the breakout?
Watch these levels on USD/CAD’s resistance confluence setup!
USD/CAD: 4-hour
USD/CAD 4-hour Forex Chart Faster with TradingView
The Loonie took a one-two punch on Monday. Collapsed trade talks between the U.S. and Canada, which officials don’t expect to resume before the midterms, sent USD/CAD gapping higher at the Asian open.
WTI, a key CAD driver, then fell more than 1.5% as markets appeared to have priced in Bessent’s “Operation Economic Outcast” after a week of Iran sanctions signals. Chip weakness ahead of Nvidia’s earnings also hit stocks and boosted greenback haven demand, leaving CAD as the worst G10 performer.
Still, CAD has a few lifelines. Vice President Vance says trade talks remain underway, while Pakistan’s army chief visited Tehran Monday in a possible de-escalation push. An oil rebound or renewed trade negotiations could quickly change the USD/CAD setup.
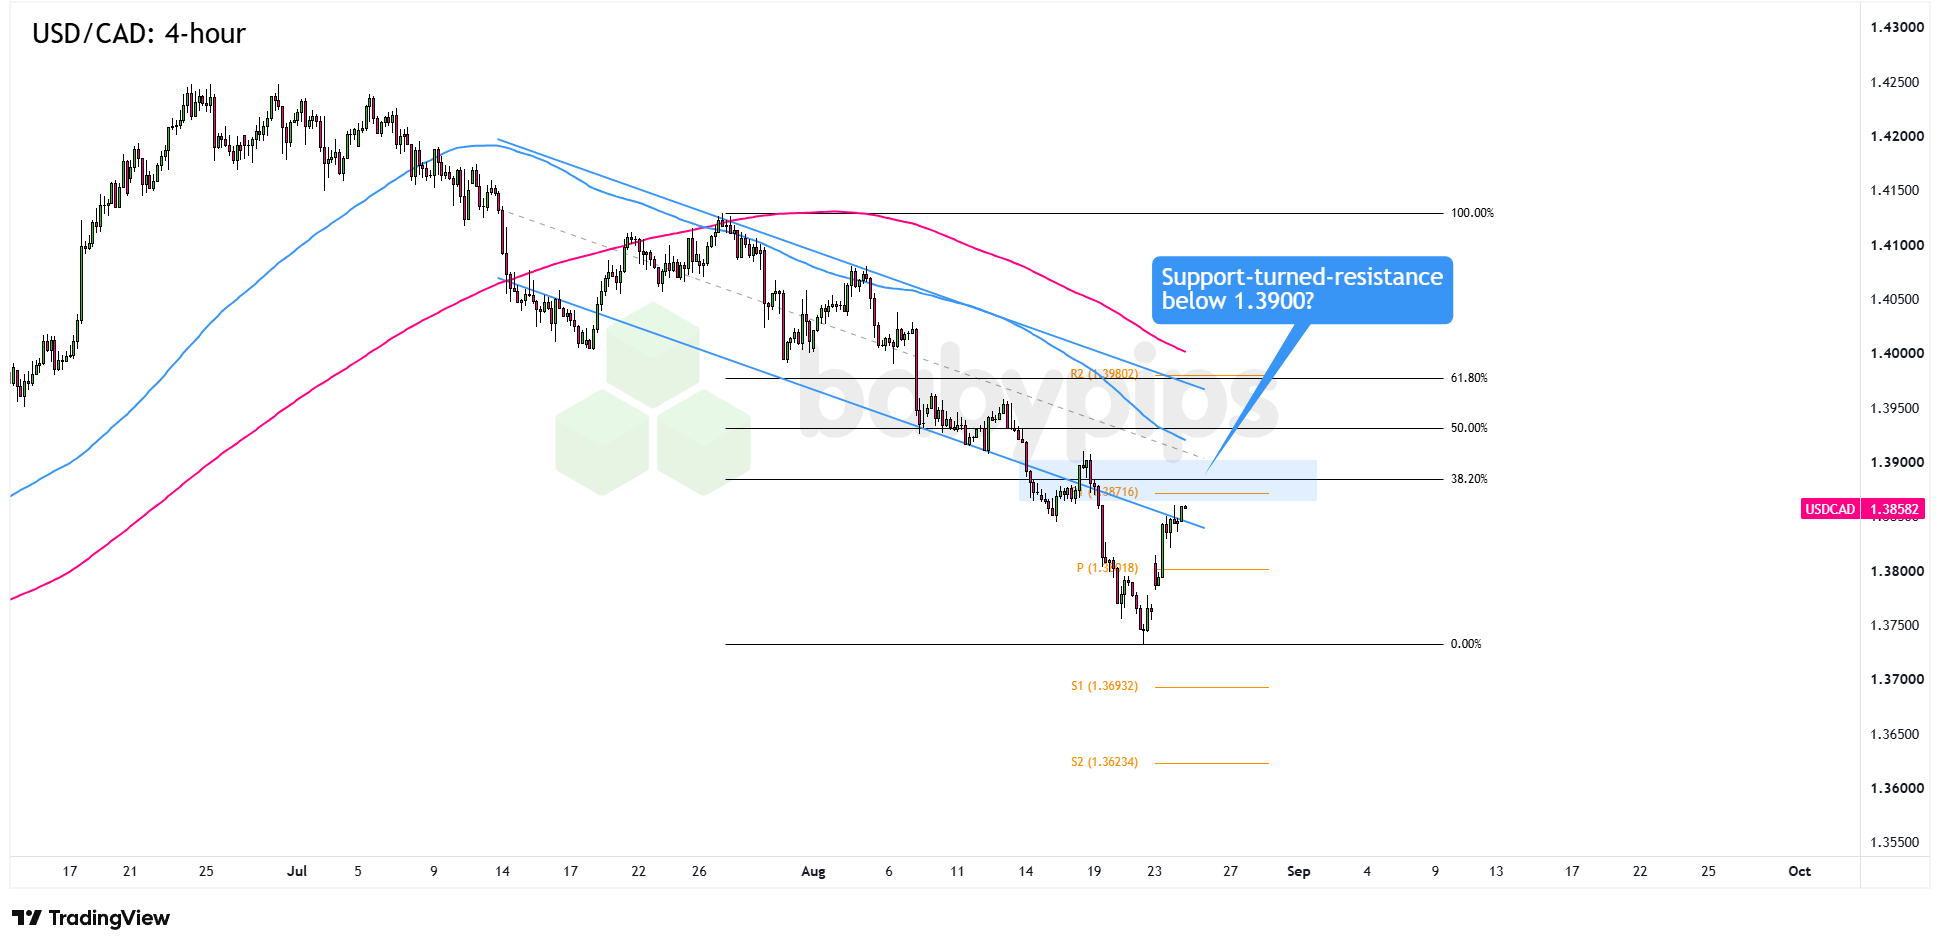
USD/CAD has rebounded sharply from 1.3750, the low of August’s extended slide. Price is now testing a stacked resistance zone just under 1.3900, where the former channel support meets the 38.2% Fibonacci retracement of August’s downswing. R1 at 1.38716 adds another layer to the support cluster.Remember that directional biases and volatility conditions in market price are typically driven by fundamentals. If you haven’t yet done your fundie homework on the U.S. dollar and the Canadian dollar, then it’s time to check out the economic calendar and stay updated on daily fundamental news!
If sellers defend the zone, the Pivot Point near 1.3842 is the first downside target, followed by S1 at 1.3693. Signs that trade talks are resuming or a rebound in WTI could help a technical rejection gain traction.
If buyers clear 1.3900, R2 at 1.3980 and the nearby 61.8% Fibonacci retracement could come into play. Sustained trading above the former channel support would weaken the bearish structure and suggest the downtrend is losing its grip.
Whichever bias you end up trading, don’t forget to practice proper risk management and stay aware of top-tier catalysts that could influence overall market sentiment!
This Chart Art piece analyzes a stacked resistance zone on USD/CAD where former channel support, a Fibonacci retracement, and a pivot point all converge, and if the concept of confluence is new to you, Premium members can read our lesson:
📖 Confluence: Stacking the Odds in Your Favor
Reading this helps you understand how multiple technical factors stack at a single price zone, what makes a confluent level carry more weight than a lone support or resistance line, and how to evaluate a setup before you take it.
And if you’re not a Premium subscriber yet, now’s a good time to sign up.
With Babypips Premium, you get full access to School of Pipsology lessons that help you understand not just what the chart is showing, but why zones where Fibonacci levels, pivot points, and broken structure all align carry more analytical weight than any one factor on its own.



