





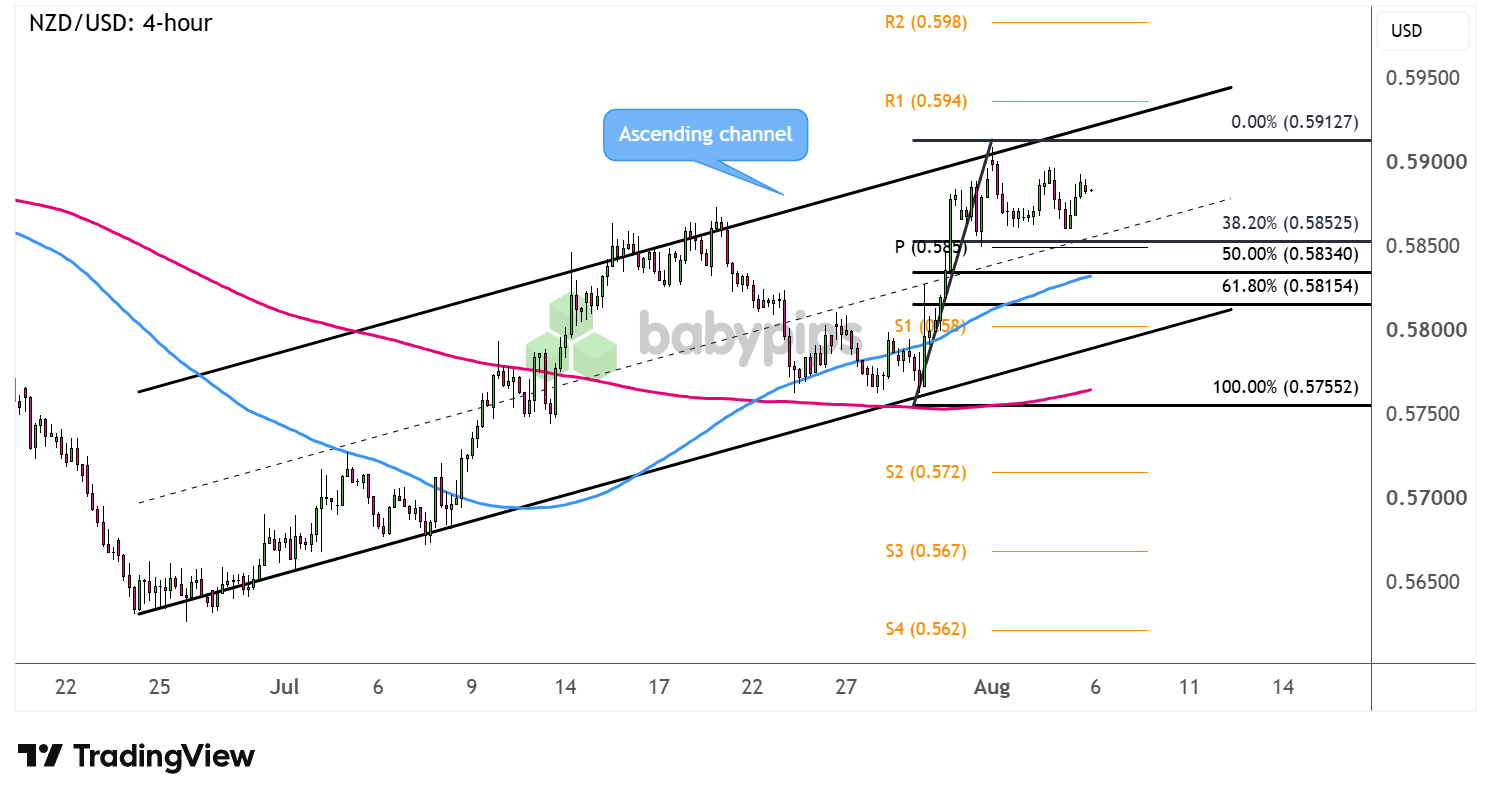
NZD/USD has been cruising inside a freshly forming ascending channel.
Will this trend pattern hold up as the pair stalls near the resistance?
Check out these correction levels where more Kiwi bulls could be waiting.
NZD/USD: 4-hour
NZD/USD 4-hour Forex Chart Faster with TradingView
Risk-taking over the past few days appears to be propping this pair higher, along with downbeat U.S. mid-tier employment reports weighing on NFP expectations.
The highly anticipated U.S. jobs report could set the tone moving forward, as significantly slower-than-expected hiring could dampen hawkish Fed hopes, while another impressive result could further support the tightening bias.
Can NZD/USD still sustain its uptrend?
NZD/USD is retreating from its ascending channel resistance, dipping close to the 38.2% Fibonacci retracement level that lines up with the pivot point (.5850) and a minor psychological support.Remember that directional biases and volatility conditions in market price are typically driven by fundamentals. If you haven’t yet done your homework on the New Zealand dollar and the U.S. dollar, then it’s time to check out the economic calendar and stay updated on daily fundamental news!
A larger correction could reach the 50% Fib, in line with the 100 SMA dynamic inflection point, or the 61.8% level, closer to the channel bottom and S1 (.5800), which happens to be a major psychological floor.
Note that the 100 SMA is still above the 200 SMA to reflect bullish pressure, and the gap between the indicators is widening to indicate strengthening momentum. That said, keep an eye out for reversal candlesticks around the potential support zones, as a continuation of the climb could take NZD/USD back to the swing high near the channel top or to fresh upside targets closer to R1 (.5940).
On the other hand, long red candlesticks closing below the channel bottom and Fibs could point to a possible reversal, likely dragging the pair to S2 (.5720) then S3 (.5670) next.
Whichever bias you end up trading, don’t forget to practice proper risk management and stay aware of top-tier catalysts that could influence overall market sentiment!
NZD/USD is pulling back from ascending channel resistance toward a cluster of Fibonacci retracement levels, and the article’s real question is whether this is just a healthy correction or the start of a full reversal, a distinction you may not be familiar with by name. Premium members can read our lesson:
📖 How to Identify Reversals and Retracements
Reading this helps you understand the difference between a retracement and a full reversal, how Fibonacci levels and pivot points help mark where a correction is likely to pause, and why trend lines and moving averages give you confirmation before deciding which scenario is actually playing out.
And if you’re not a Premium subscriber yet, now’s a good time to sign up.
With Babypips Premium, you get full access to School of Pipsology lessons that help you understand not just where the Fib levels sit on a chart like this one, but how to read whether a pullback is a healthy correction or the early stage of a full trend reversal.



