


This Kiwi pair has been forming higher highs and higher lows inside an ascending trend channel.
Can the uptrend keep gaining traction?
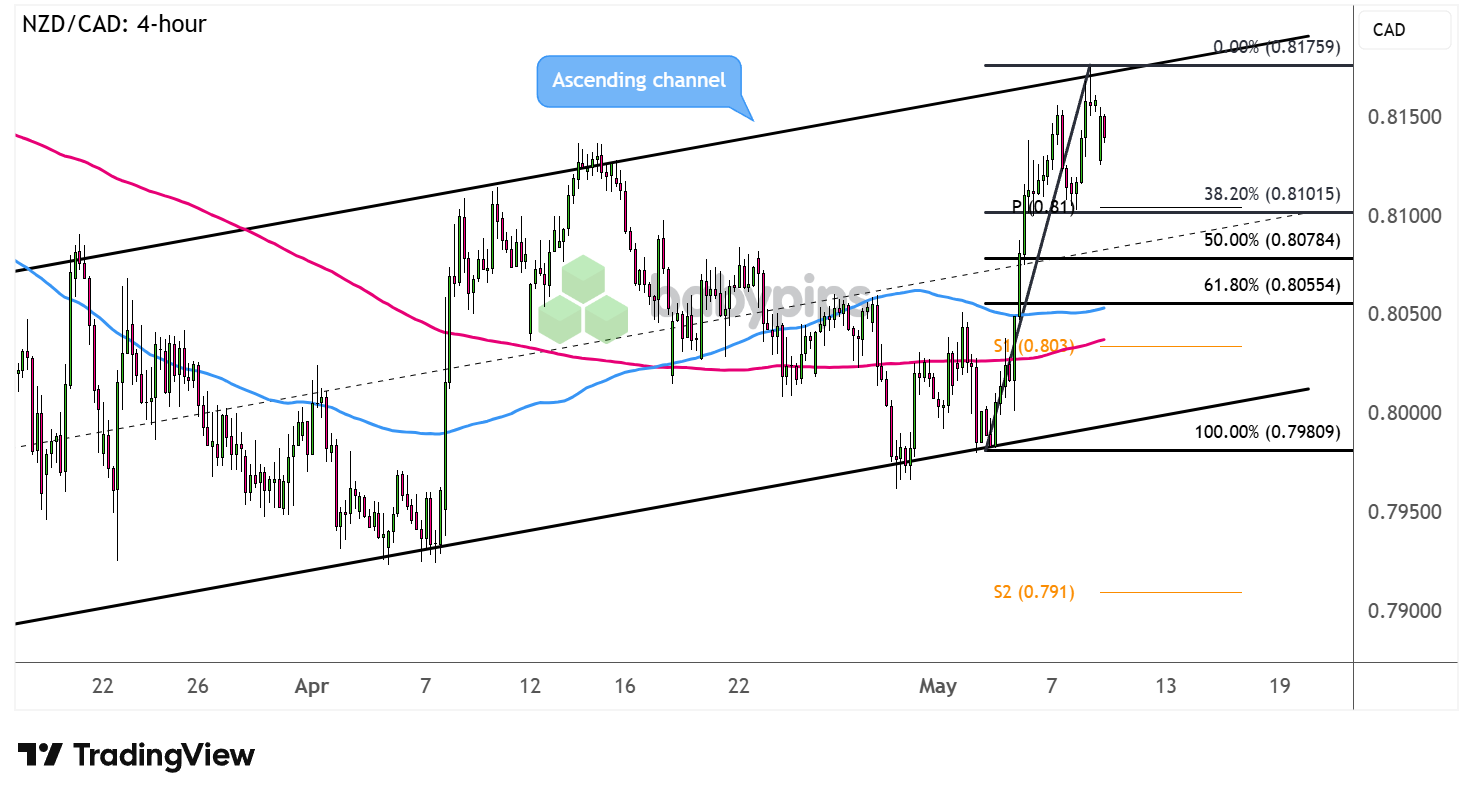
Check out these potential pullback levels on the 4-hour chart!
NZD/CAD: 4-hour
NZD/CAD 4-hour Forex Chart Faster With TradingView
Strengthening RBNZ tightening hopes, likely spurred by upbeat New Zealand quarterly jobs data, appear to be propping the Kiwi higher against its comdoll rivals.
However, the oil-related Loonie could also get a boost from energy-commodity rallies while global supply remains in the balance.
Will we see a pullback from the ongoing climb?
The pair is currently testing the top of its ascending channel near the .8150 minor psychological resistance. Should this ceiling keep holding, NZD/CAD could retreat to the nearby support zones marked by the Fibonacci retracement tool.Remember that directional biases and volatility conditions in market price are typically driven by fundamentals. If you haven’t yet done your homework on the New Zealand dollar and the Canadian dollar, then it’s time to check out the economic calendar and stay updated on daily fundamental news!
The 38.2% level aligns with the pivot point (.8100) and a major psychological mark, making it an attractive entry point for buyers. A larger correction could still reach the 50% Fib closer to the mid-channel area of interest or the 61.8% level just slightly above the .8050 mark.
Watch out for reversal candlesticks that could suggest a bounce at any of these support zones, potentially lifting NZD/CAD back up to the swing high or higher.
On the flip side, long red candles closing below the channel bottom could point to a reversal from the uptrend.
Whichever bias you end up trading, don’t forget to practice proper risk management and stay aware of top-tier catalysts that could influence overall market sentiment.
Disclaimer:
Please be aware that the technical analysis content provided herein is for informational and educational purposes only. It should not be construed as trading advice or a suggestion of any specific directional bias. Technical analysis is just one aspect of a comprehensive trading strategy. The technical setups discussed are intended to highlight potential areas of interest that other traders may be observing. Ultimately, all trading decisions, risk management strategies, and their resulting outcomes are the sole responsibility of each individual trader. Please trade responsibly.
This article references an ascending trend channel, higher highs, and higher lows on NZD/CAD, which may be unfamiliar concepts if you haven’t studied market structure yet. Premium members can read our lesson:
📖 Market Structure: Trends and Ranges
Reading this helps you understand how trending markets are structured, how to identify the sequence of highs and lows that defines a trend, and how to tell who is in control between buyers and sellers before you look for a trade.
And if you’re not a Premium subscriber yet, now’s a good time to sign up.
With Babypips Premium, you get full access to School of Pipsology lessons that help you understand not just what a chart pattern looks like, but the market structure principles that explain why price moves the way it does inside a trend.


